Lithuanian vs Immigrants from Dominica Family Households
COMPARE
Lithuanian
Immigrants from Dominica
Family Households
Family Households Comparison
Lithuanians
Immigrants from Dominica
64.0%
FAMILY HOUSEHOLDS
23.8/ 100
METRIC RATING
192nd/ 347
METRIC RANK
63.4%
FAMILY HOUSEHOLDS
1.6/ 100
METRIC RATING
245th/ 347
METRIC RANK
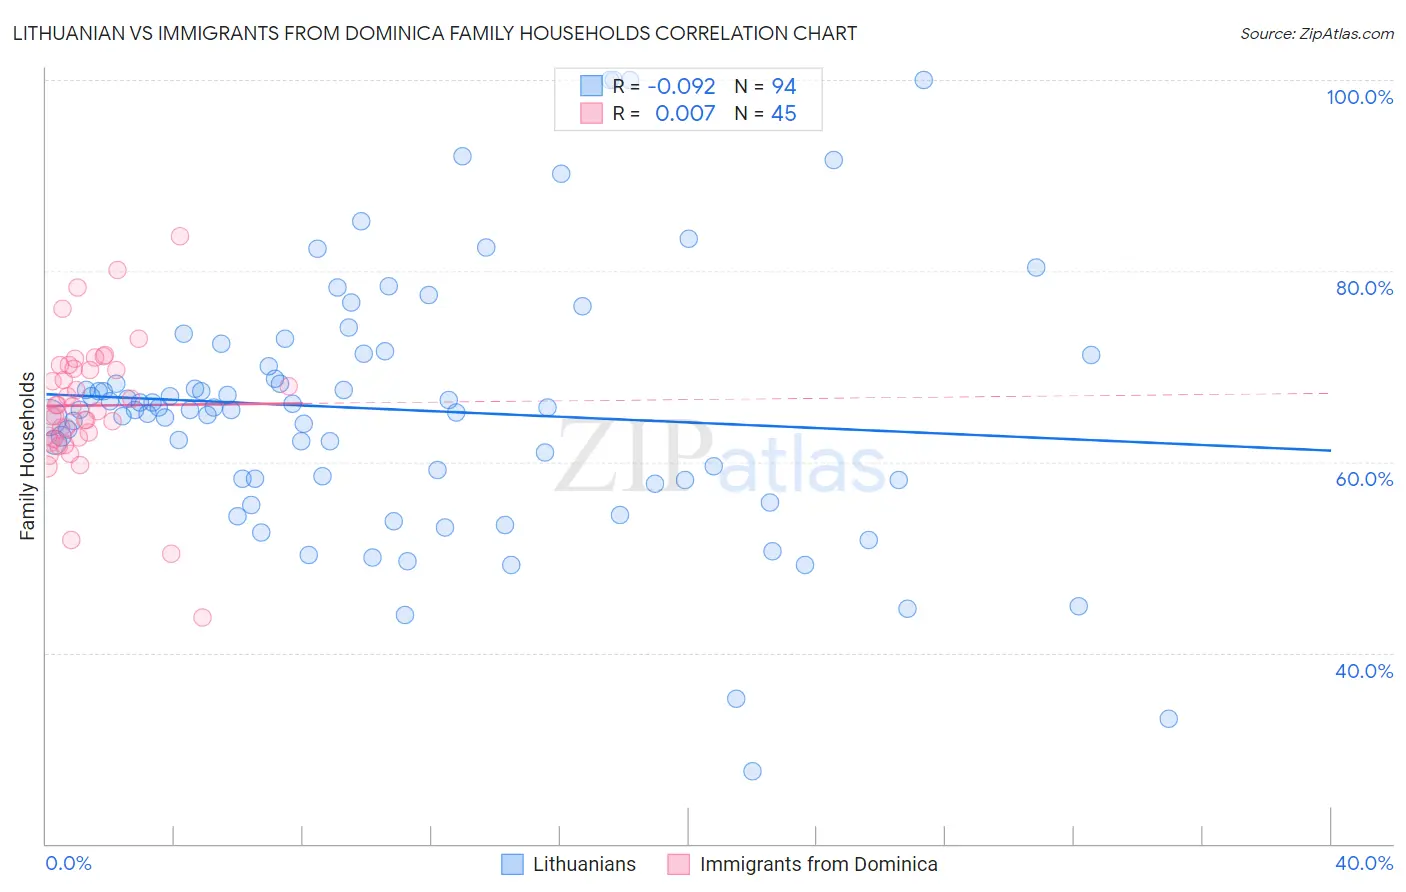
Lithuanian vs Immigrants from Dominica Family Households Correlation Chart
The statistical analysis conducted on geographies consisting of 421,743,433 people shows a slight negative correlation between the proportion of Lithuanians and percentage of family households in the United States with a correlation coefficient (R) of -0.092 and weighted average of 64.0%. Similarly, the statistical analysis conducted on geographies consisting of 83,778,248 people shows no correlation between the proportion of Immigrants from Dominica and percentage of family households in the United States with a correlation coefficient (R) of 0.007 and weighted average of 63.4%, a difference of 1.0%.
Family Households Correlation Summary
| Measurement | Lithuanian | Immigrants from Dominica |
| Minimum | 27.6% | 43.8% |
| Maximum | 100.0% | 83.7% |
| Range | 72.4% | 39.9% |
| Mean | 65.5% | 65.9% |
| Median | 65.5% | 65.8% |
| Interquartile 25% (IQ1) | 58.1% | 62.5% |
| Interquartile 75% (IQ3) | 71.3% | 69.9% |
| Interquartile Range (IQR) | 13.1% | 7.5% |
| Standard Deviation (Sample) | 13.6% | 7.1% |
| Standard Deviation (Population) | 13.6% | 7.0% |
Similar Demographics by Family Households
Demographics Similar to Lithuanians by Family Households
In terms of family households, the demographic groups most similar to Lithuanians are French (64.0%, a difference of 0.0%), Arab (64.1%, a difference of 0.010%), Zimbabwean (64.1%, a difference of 0.020%), Immigrants from Western Asia (64.1%, a difference of 0.030%), and Paiute (64.0%, a difference of 0.030%).
| Demographics | Rating | Rank | Family Households |
| Immigrants | Iran | 30.4 /100 | #185 | Fair 64.1% |
| Spanish Americans | 30.1 /100 | #186 | Fair 64.1% |
| Northern Europeans | 28.2 /100 | #187 | Fair 64.1% |
| Paraguayans | 26.7 /100 | #188 | Fair 64.1% |
| Immigrants | Western Asia | 25.3 /100 | #189 | Fair 64.1% |
| Zimbabweans | 24.7 /100 | #190 | Fair 64.1% |
| Arabs | 24.5 /100 | #191 | Fair 64.1% |
| Lithuanians | 23.8 /100 | #192 | Fair 64.0% |
| French | 23.7 /100 | #193 | Fair 64.0% |
| Paiute | 22.2 /100 | #194 | Fair 64.0% |
| Immigrants | North America | 20.0 /100 | #195 | Poor 64.0% |
| Immigrants | Canada | 19.2 /100 | #196 | Poor 64.0% |
| Seminole | 18.9 /100 | #197 | Poor 64.0% |
| Poles | 18.9 /100 | #198 | Poor 64.0% |
| Slavs | 18.6 /100 | #199 | Poor 64.0% |
Demographics Similar to Immigrants from Dominica by Family Households
In terms of family households, the demographic groups most similar to Immigrants from Dominica are Eastern European (63.4%, a difference of 0.0%), Immigrants from Ghana (63.4%, a difference of 0.020%), Immigrants from Czechoslovakia (63.4%, a difference of 0.030%), Immigrants from Uzbekistan (63.4%, a difference of 0.030%), and Immigrants from Israel (63.4%, a difference of 0.040%).
| Demographics | Rating | Rank | Family Households |
| Immigrants | Zimbabwe | 2.0 /100 | #238 | Tragic 63.5% |
| Aleuts | 1.9 /100 | #239 | Tragic 63.4% |
| South Africans | 1.9 /100 | #240 | Tragic 63.4% |
| Immigrants | St. Vincent and the Grenadines | 1.9 /100 | #241 | Tragic 63.4% |
| Immigrants | Israel | 1.8 /100 | #242 | Tragic 63.4% |
| Immigrants | Czechoslovakia | 1.8 /100 | #243 | Tragic 63.4% |
| Eastern Europeans | 1.6 /100 | #244 | Tragic 63.4% |
| Immigrants | Dominica | 1.6 /100 | #245 | Tragic 63.4% |
| Immigrants | Ghana | 1.6 /100 | #246 | Tragic 63.4% |
| Immigrants | Uzbekistan | 1.5 /100 | #247 | Tragic 63.4% |
| Dominicans | 1.5 /100 | #248 | Tragic 63.4% |
| Russians | 1.4 /100 | #249 | Tragic 63.4% |
| Immigrants | Japan | 1.4 /100 | #250 | Tragic 63.4% |
| Taiwanese | 1.2 /100 | #251 | Tragic 63.3% |
| Bahamians | 1.1 /100 | #252 | Tragic 63.3% |