Cherokee vs Immigrants from Sudan Family Households
COMPARE
Cherokee
Immigrants from Sudan
Family Households
Family Households Comparison
Cherokee
Immigrants from Sudan
65.0%
FAMILY HOUSEHOLDS
95.3/ 100
METRIC RATING
117th/ 347
METRIC RANK
60.2%
FAMILY HOUSEHOLDS
0.0/ 100
METRIC RATING
340th/ 347
METRIC RANK
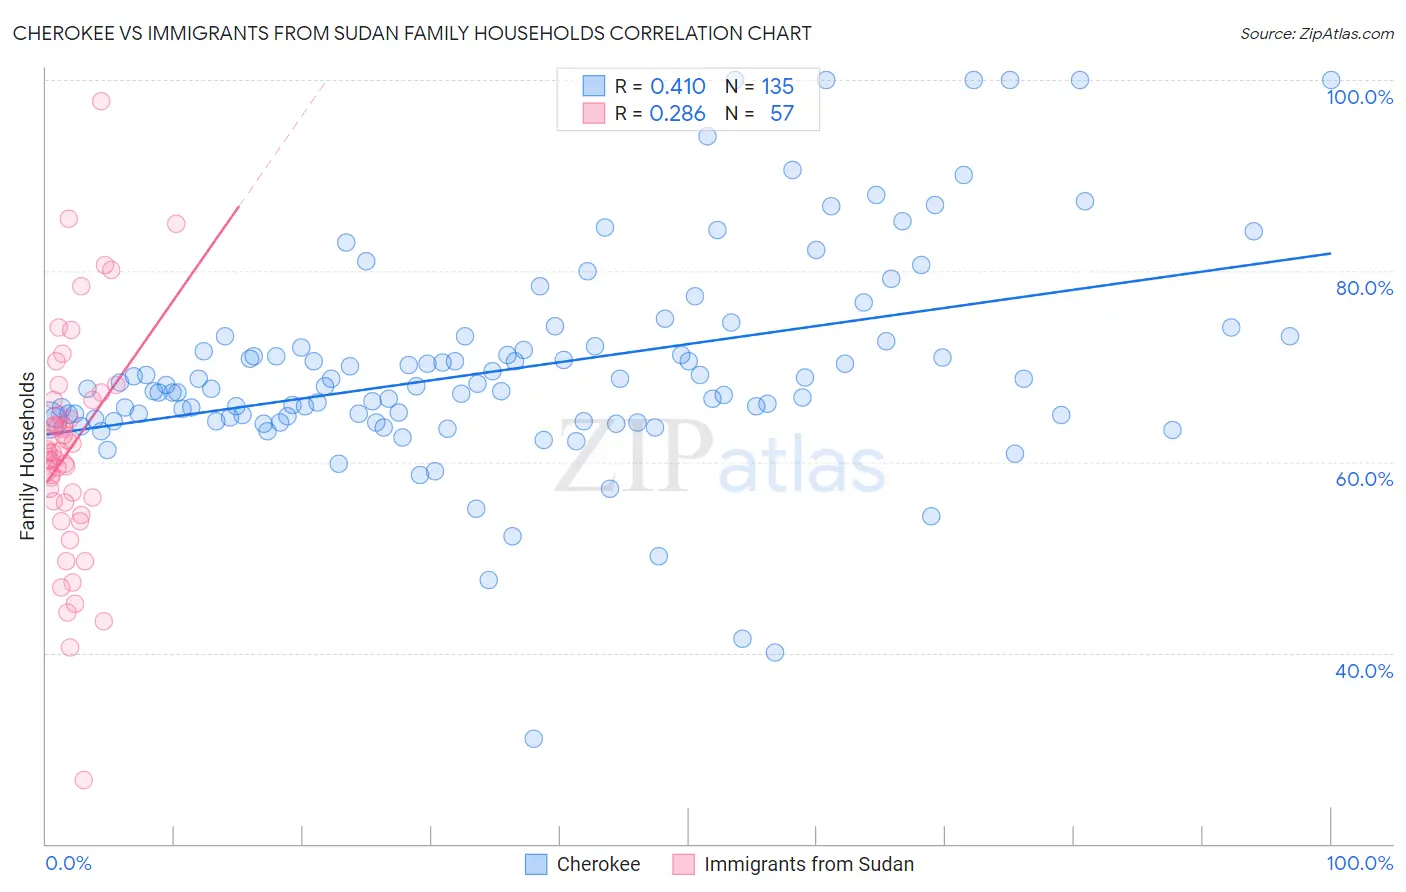
Cherokee vs Immigrants from Sudan Family Households Correlation Chart
The statistical analysis conducted on geographies consisting of 493,383,151 people shows a moderate positive correlation between the proportion of Cherokee and percentage of family households in the United States with a correlation coefficient (R) of 0.410 and weighted average of 65.0%. Similarly, the statistical analysis conducted on geographies consisting of 118,943,916 people shows a weak positive correlation between the proportion of Immigrants from Sudan and percentage of family households in the United States with a correlation coefficient (R) of 0.286 and weighted average of 60.2%, a difference of 8.0%.
Family Households Correlation Summary
| Measurement | Cherokee | Immigrants from Sudan |
| Minimum | 31.0% | 26.6% |
| Maximum | 100.0% | 97.8% |
| Range | 69.0% | 71.1% |
| Mean | 69.9% | 61.4% |
| Median | 67.9% | 61.0% |
| Interquartile 25% (IQ1) | 64.5% | 55.8% |
| Interquartile 75% (IQ3) | 72.7% | 66.4% |
| Interquartile Range (IQR) | 8.2% | 10.6% |
| Standard Deviation (Sample) | 11.2% | 11.8% |
| Standard Deviation (Population) | 11.2% | 11.7% |
Similar Demographics by Family Households
Demographics Similar to Cherokee by Family Households
In terms of family households, the demographic groups most similar to Cherokee are Immigrants from Iraq (65.0%, a difference of 0.0%), Ecuadorian (65.0%, a difference of 0.010%), Dutch (64.9%, a difference of 0.020%), Argentinean (65.0%, a difference of 0.030%), and Immigrants from Eastern Asia (64.9%, a difference of 0.060%).
| Demographics | Rating | Rank | Family Households |
| Scandinavians | 96.8 /100 | #110 | Exceptional 65.0% |
| Europeans | 96.8 /100 | #111 | Exceptional 65.0% |
| Immigrants | Jordan | 96.5 /100 | #112 | Exceptional 65.0% |
| Spanish | 96.2 /100 | #113 | Exceptional 65.0% |
| Argentineans | 95.7 /100 | #114 | Exceptional 65.0% |
| Ecuadorians | 95.4 /100 | #115 | Exceptional 65.0% |
| Immigrants | Iraq | 95.4 /100 | #116 | Exceptional 65.0% |
| Cherokee | 95.3 /100 | #117 | Exceptional 65.0% |
| Dutch | 95.1 /100 | #118 | Exceptional 64.9% |
| Immigrants | Eastern Asia | 94.4 /100 | #119 | Exceptional 64.9% |
| Immigrants | Oceania | 94.2 /100 | #120 | Exceptional 64.9% |
| Hungarians | 94.0 /100 | #121 | Exceptional 64.9% |
| Hmong | 93.4 /100 | #122 | Exceptional 64.9% |
| Choctaw | 93.4 /100 | #123 | Exceptional 64.9% |
| Immigrants | Argentina | 92.8 /100 | #124 | Exceptional 64.9% |
Demographics Similar to Immigrants from Sudan by Family Households
In terms of family households, the demographic groups most similar to Immigrants from Sudan are Immigrants from Senegal (60.1%, a difference of 0.080%), Sudanese (60.0%, a difference of 0.27%), Senegalese (59.8%, a difference of 0.57%), Immigrants from Saudi Arabia (60.7%, a difference of 0.89%), and Immigrants from Eritrea (60.8%, a difference of 1.1%).
| Demographics | Rating | Rank | Family Households |
| Immigrants | Ethiopia | 0.0 /100 | #333 | Tragic 61.2% |
| Immigrants | Eastern Africa | 0.0 /100 | #334 | Tragic 61.1% |
| Carpatho Rusyns | 0.0 /100 | #335 | Tragic 61.1% |
| German Russians | 0.0 /100 | #336 | Tragic 60.9% |
| Soviet Union | 0.0 /100 | #337 | Tragic 60.9% |
| Immigrants | Eritrea | 0.0 /100 | #338 | Tragic 60.8% |
| Immigrants | Saudi Arabia | 0.0 /100 | #339 | Tragic 60.7% |
| Immigrants | Sudan | 0.0 /100 | #340 | Tragic 60.2% |
| Immigrants | Senegal | 0.0 /100 | #341 | Tragic 60.1% |
| Sudanese | 0.0 /100 | #342 | Tragic 60.0% |
| Senegalese | 0.0 /100 | #343 | Tragic 59.8% |
| Immigrants | Congo | 0.0 /100 | #344 | Tragic 59.2% |
| Immigrants | Zaire | 0.0 /100 | #345 | Tragic 59.2% |
| Somalis | 0.0 /100 | #346 | Tragic 57.6% |
| Immigrants | Somalia | 0.0 /100 | #347 | Tragic 56.7% |