Tsimshian vs Immigrants from Sudan Family Households
COMPARE
Tsimshian
Immigrants from Sudan
Family Households
Family Households Comparison
Tsimshian
Immigrants from Sudan
67.1%
FAMILY HOUSEHOLDS
100.0/ 100
METRIC RATING
37th/ 347
METRIC RANK
60.2%
FAMILY HOUSEHOLDS
0.0/ 100
METRIC RATING
340th/ 347
METRIC RANK
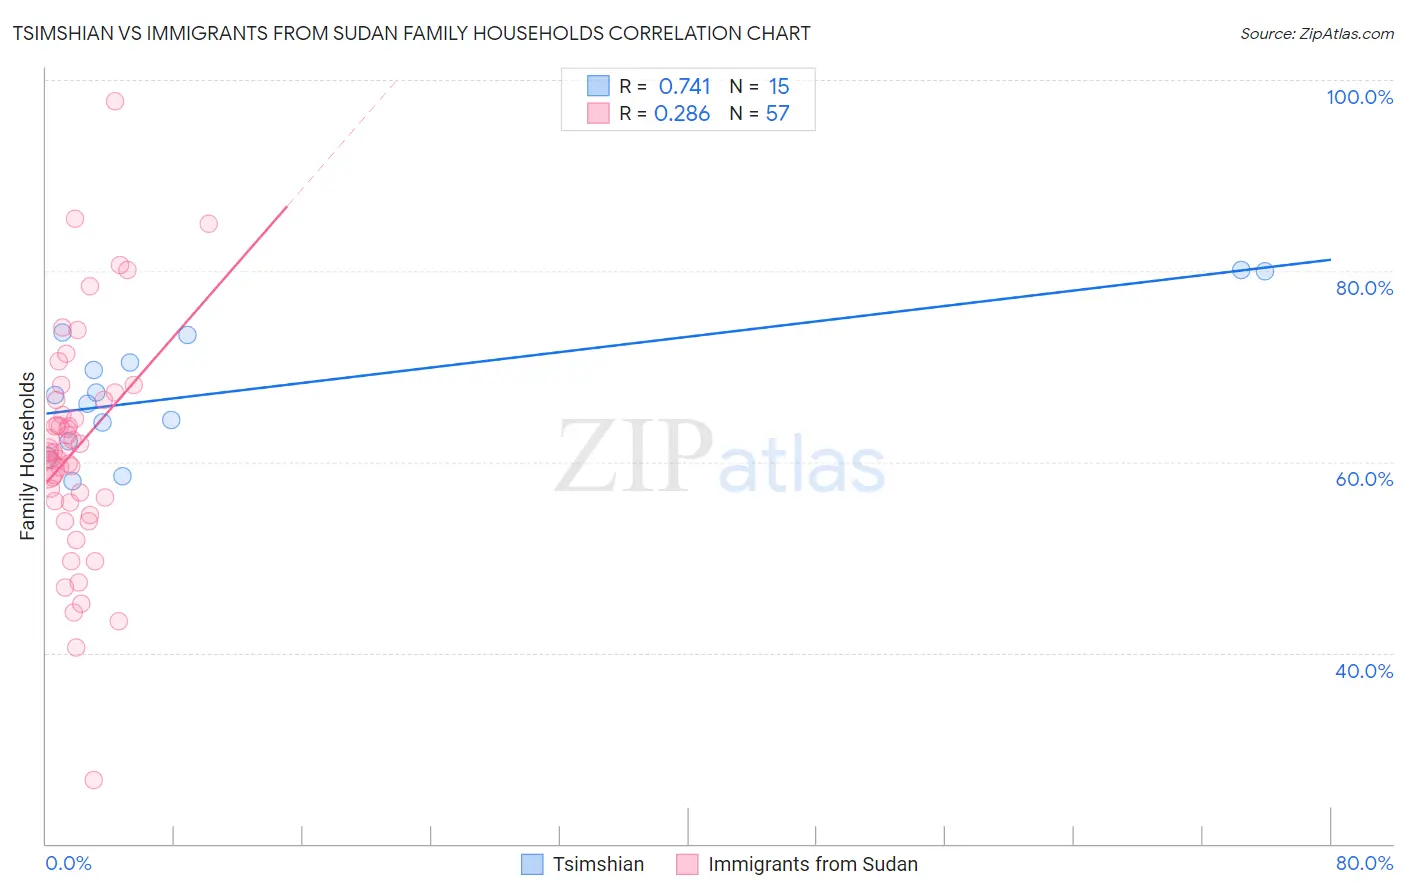
Tsimshian vs Immigrants from Sudan Family Households Correlation Chart
The statistical analysis conducted on geographies consisting of 15,626,544 people shows a strong positive correlation between the proportion of Tsimshian and percentage of family households in the United States with a correlation coefficient (R) of 0.741 and weighted average of 67.1%. Similarly, the statistical analysis conducted on geographies consisting of 118,943,916 people shows a weak positive correlation between the proportion of Immigrants from Sudan and percentage of family households in the United States with a correlation coefficient (R) of 0.286 and weighted average of 60.2%, a difference of 11.5%.
Family Households Correlation Summary
| Measurement | Tsimshian | Immigrants from Sudan |
| Minimum | 58.0% | 26.6% |
| Maximum | 80.1% | 97.8% |
| Range | 22.1% | 71.1% |
| Mean | 67.7% | 61.4% |
| Median | 67.0% | 61.0% |
| Interquartile 25% (IQ1) | 62.2% | 55.8% |
| Interquartile 75% (IQ3) | 73.3% | 66.4% |
| Interquartile Range (IQR) | 11.1% | 10.6% |
| Standard Deviation (Sample) | 6.9% | 11.8% |
| Standard Deviation (Population) | 6.7% | 11.7% |
Similar Demographics by Family Households
Demographics Similar to Tsimshian by Family Households
In terms of family households, the demographic groups most similar to Tsimshian are Peruvian (67.1%, a difference of 0.070%), Tohono O'odham (67.1%, a difference of 0.080%), Mexican American Indian (67.0%, a difference of 0.10%), Immigrants from El Salvador (67.0%, a difference of 0.12%), and Salvadoran (67.2%, a difference of 0.13%).
| Demographics | Rating | Rank | Family Households |
| Immigrants | Peru | 100.0 /100 | #30 | Exceptional 67.2% |
| Immigrants | Latin America | 100.0 /100 | #31 | Exceptional 67.2% |
| Nepalese | 100.0 /100 | #32 | Exceptional 67.2% |
| Salvadorans | 100.0 /100 | #33 | Exceptional 67.2% |
| Thais | 100.0 /100 | #34 | Exceptional 67.2% |
| Tohono O'odham | 100.0 /100 | #35 | Exceptional 67.1% |
| Peruvians | 100.0 /100 | #36 | Exceptional 67.1% |
| Tsimshian | 100.0 /100 | #37 | Exceptional 67.1% |
| Mexican American Indians | 100.0 /100 | #38 | Exceptional 67.0% |
| Immigrants | El Salvador | 100.0 /100 | #39 | Exceptional 67.0% |
| Guamanians/Chamorros | 100.0 /100 | #40 | Exceptional 66.6% |
| Immigrants | Bolivia | 100.0 /100 | #41 | Exceptional 66.6% |
| Menominee | 100.0 /100 | #42 | Exceptional 66.5% |
| Apache | 100.0 /100 | #43 | Exceptional 66.5% |
| Asians | 100.0 /100 | #44 | Exceptional 66.5% |
Demographics Similar to Immigrants from Sudan by Family Households
In terms of family households, the demographic groups most similar to Immigrants from Sudan are Immigrants from Senegal (60.1%, a difference of 0.080%), Sudanese (60.0%, a difference of 0.27%), Senegalese (59.8%, a difference of 0.57%), Immigrants from Saudi Arabia (60.7%, a difference of 0.89%), and Immigrants from Eritrea (60.8%, a difference of 1.1%).
| Demographics | Rating | Rank | Family Households |
| Immigrants | Ethiopia | 0.0 /100 | #333 | Tragic 61.2% |
| Immigrants | Eastern Africa | 0.0 /100 | #334 | Tragic 61.1% |
| Carpatho Rusyns | 0.0 /100 | #335 | Tragic 61.1% |
| German Russians | 0.0 /100 | #336 | Tragic 60.9% |
| Soviet Union | 0.0 /100 | #337 | Tragic 60.9% |
| Immigrants | Eritrea | 0.0 /100 | #338 | Tragic 60.8% |
| Immigrants | Saudi Arabia | 0.0 /100 | #339 | Tragic 60.7% |
| Immigrants | Sudan | 0.0 /100 | #340 | Tragic 60.2% |
| Immigrants | Senegal | 0.0 /100 | #341 | Tragic 60.1% |
| Sudanese | 0.0 /100 | #342 | Tragic 60.0% |
| Senegalese | 0.0 /100 | #343 | Tragic 59.8% |
| Immigrants | Congo | 0.0 /100 | #344 | Tragic 59.2% |
| Immigrants | Zaire | 0.0 /100 | #345 | Tragic 59.2% |
| Somalis | 0.0 /100 | #346 | Tragic 57.6% |
| Immigrants | Somalia | 0.0 /100 | #347 | Tragic 56.7% |