Lithuanian vs Norwegian Births to Unmarried Women
COMPARE
Lithuanian
Norwegian
Births to Unmarried Women
Births to Unmarried Women Comparison
Lithuanians
Norwegians
29.6%
BIRTHS TO UNMARRIED WOMEN
94.4/ 100
METRIC RATING
104th/ 347
METRIC RANK
29.3%
BIRTHS TO UNMARRIED WOMEN
95.8/ 100
METRIC RATING
96th/ 347
METRIC RANK
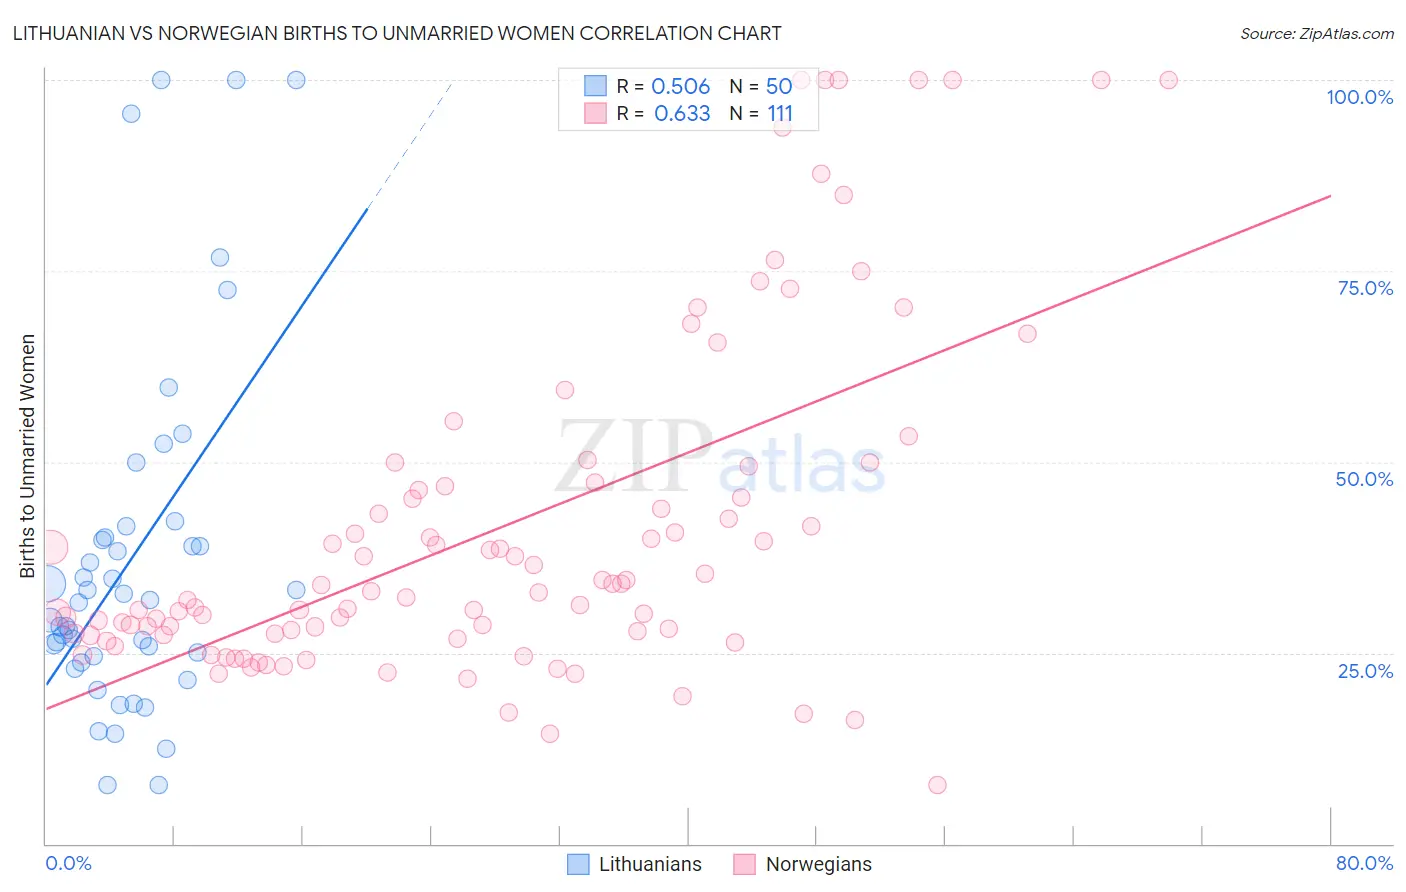
Lithuanian vs Norwegian Births to Unmarried Women Correlation Chart
The statistical analysis conducted on geographies consisting of 385,212,926 people shows a substantial positive correlation between the proportion of Lithuanians and percentage of births to unmarried women in the United States with a correlation coefficient (R) of 0.506 and weighted average of 29.6%. Similarly, the statistical analysis conducted on geographies consisting of 477,355,885 people shows a significant positive correlation between the proportion of Norwegians and percentage of births to unmarried women in the United States with a correlation coefficient (R) of 0.633 and weighted average of 29.3%, a difference of 0.74%.
Births to Unmarried Women Correlation Summary
| Measurement | Lithuanian | Norwegian |
| Minimum | 7.7% | 7.7% |
| Maximum | 100.0% | 100.0% |
| Range | 92.3% | 92.3% |
| Mean | 37.3% | 41.3% |
| Median | 31.8% | 32.9% |
| Interquartile 25% (IQ1) | 24.6% | 27.3% |
| Interquartile 75% (IQ3) | 40.0% | 46.7% |
| Interquartile Range (IQR) | 15.4% | 19.4% |
| Standard Deviation (Sample) | 23.1% | 22.3% |
| Standard Deviation (Population) | 22.9% | 22.2% |
Demographics Similar to Lithuanians and Norwegians by Births to Unmarried Women
In terms of births to unmarried women, the demographic groups most similar to Lithuanians are Lebanese (29.5%, a difference of 0.010%), Immigrants from Nepal (29.6%, a difference of 0.050%), Australian (29.5%, a difference of 0.060%), Immigrants from Northern Africa (29.5%, a difference of 0.14%), and Swedish (29.6%, a difference of 0.30%). Similarly, the demographic groups most similar to Norwegians are Immigrants from South Africa (29.3%, a difference of 0.040%), Immigrants from Syria (29.4%, a difference of 0.070%), Immigrants from Vietnam (29.3%, a difference of 0.23%), Immigrants from Denmark (29.4%, a difference of 0.30%), and Luxembourger (29.4%, a difference of 0.30%).
| Demographics | Rating | Rank | Births to Unmarried Women |
| Immigrants | Latvia | 96.8 /100 | #90 | Exceptional 29.1% |
| Immigrants | Fiji | 96.6 /100 | #91 | Exceptional 29.2% |
| Arabs | 96.5 /100 | #92 | Exceptional 29.2% |
| Estonians | 96.5 /100 | #93 | Exceptional 29.2% |
| Ukrainians | 96.3 /100 | #94 | Exceptional 29.2% |
| Immigrants | Vietnam | 96.1 /100 | #95 | Exceptional 29.3% |
| Norwegians | 95.8 /100 | #96 | Exceptional 29.3% |
| Immigrants | South Africa | 95.7 /100 | #97 | Exceptional 29.3% |
| Immigrants | Syria | 95.7 /100 | #98 | Exceptional 29.4% |
| Immigrants | Denmark | 95.3 /100 | #99 | Exceptional 29.4% |
| Luxembourgers | 95.2 /100 | #100 | Exceptional 29.4% |
| Immigrants | Northern Africa | 94.7 /100 | #101 | Exceptional 29.5% |
| Australians | 94.6 /100 | #102 | Exceptional 29.5% |
| Lebanese | 94.4 /100 | #103 | Exceptional 29.5% |
| Lithuanians | 94.4 /100 | #104 | Exceptional 29.6% |
| Immigrants | Nepal | 94.3 /100 | #105 | Exceptional 29.6% |
| Swedes | 93.8 /100 | #106 | Exceptional 29.6% |
| Immigrants | Brazil | 93.7 /100 | #107 | Exceptional 29.6% |
| Paraguayans | 93.5 /100 | #108 | Exceptional 29.7% |
| Greeks | 93.4 /100 | #109 | Exceptional 29.7% |
| Immigrants | Ethiopia | 93.4 /100 | #110 | Exceptional 29.7% |