Central American vs American Births to Unmarried Women
COMPARE
Central American
American
Births to Unmarried Women
Births to Unmarried Women Comparison
Central Americans
Americans
36.7%
BIRTHS TO UNMARRIED WOMEN
0.1/ 100
METRIC RATING
267th/ 347
METRIC RANK
36.4%
BIRTHS TO UNMARRIED WOMEN
0.2/ 100
METRIC RATING
258th/ 347
METRIC RANK
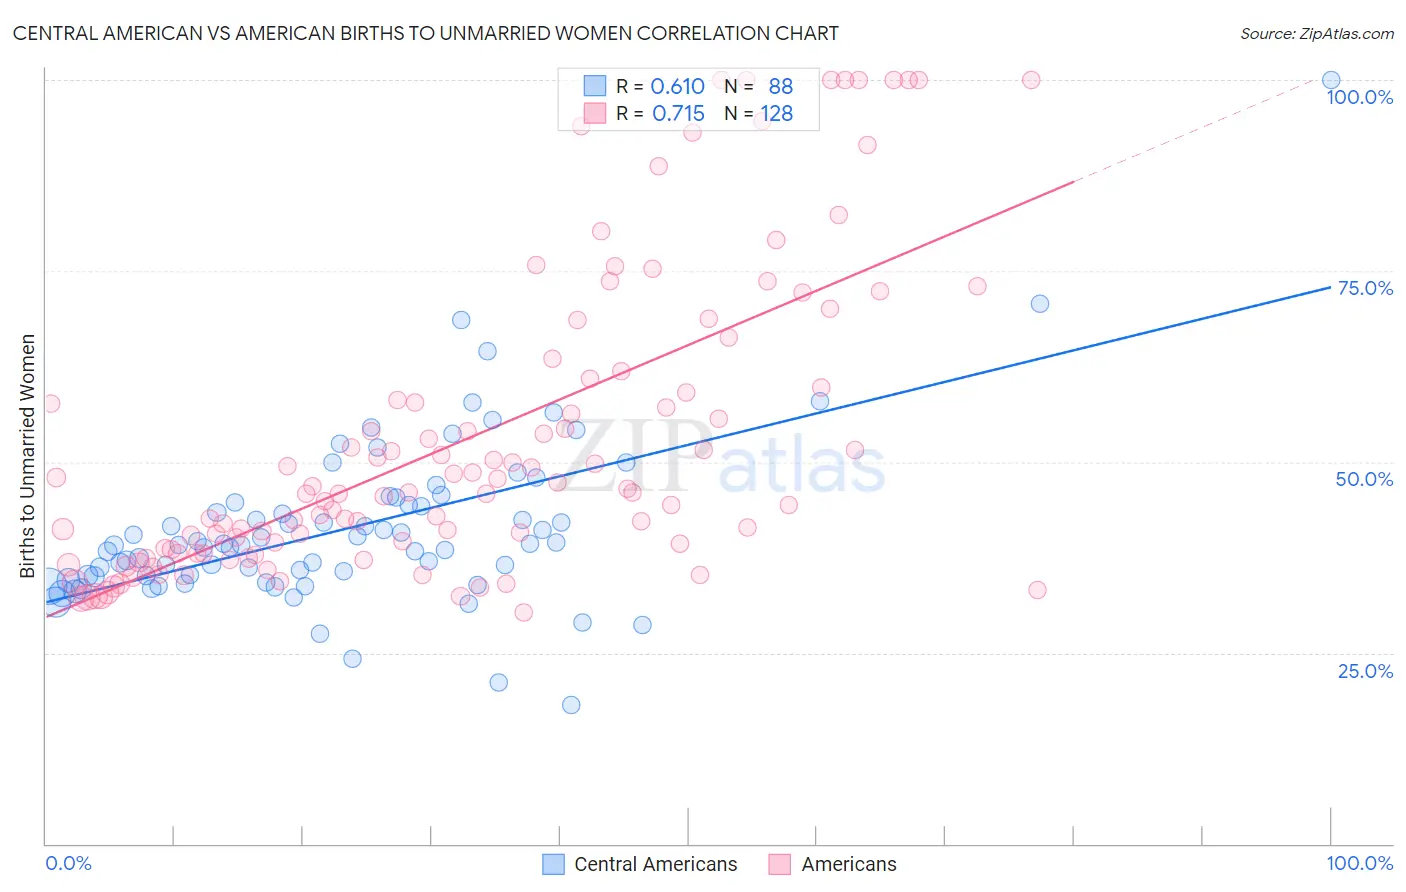
Central American vs American Births to Unmarried Women Correlation Chart
The statistical analysis conducted on geographies consisting of 464,543,910 people shows a significant positive correlation between the proportion of Central Americans and percentage of births to unmarried women in the United States with a correlation coefficient (R) of 0.610 and weighted average of 36.7%. Similarly, the statistical analysis conducted on geographies consisting of 512,571,138 people shows a strong positive correlation between the proportion of Americans and percentage of births to unmarried women in the United States with a correlation coefficient (R) of 0.715 and weighted average of 36.4%, a difference of 0.85%.
Births to Unmarried Women Correlation Summary
| Measurement | Central American | American |
| Minimum | 18.1% | 30.2% |
| Maximum | 100.0% | 100.0% |
| Range | 81.9% | 69.8% |
| Mean | 41.3% | 53.1% |
| Median | 39.1% | 46.0% |
| Interquartile 25% (IQ1) | 35.0% | 38.3% |
| Interquartile 75% (IQ3) | 44.6% | 60.3% |
| Interquartile Range (IQR) | 9.5% | 22.0% |
| Standard Deviation (Sample) | 11.2% | 19.8% |
| Standard Deviation (Population) | 11.1% | 19.7% |
Demographics Similar to Central Americans and Americans by Births to Unmarried Women
In terms of births to unmarried women, the demographic groups most similar to Central Americans are Comanche (36.7%, a difference of 0.010%), Immigrants from Senegal (36.7%, a difference of 0.070%), Cherokee (36.7%, a difference of 0.12%), Senegalese (36.8%, a difference of 0.13%), and Subsaharan African (36.7%, a difference of 0.17%). Similarly, the demographic groups most similar to Americans are Immigrants from El Salvador (36.4%, a difference of 0.050%), Ottawa (36.5%, a difference of 0.16%), Trinidadian and Tobagonian (36.5%, a difference of 0.17%), Immigrants from Grenada (36.3%, a difference of 0.28%), and Chickasaw (36.3%, a difference of 0.31%).
| Demographics | Rating | Rank | Births to Unmarried Women |
| Salvadorans | 0.3 /100 | #252 | Tragic 36.0% |
| Immigrants | Portugal | 0.2 /100 | #253 | Tragic 36.2% |
| Potawatomi | 0.2 /100 | #254 | Tragic 36.2% |
| Chickasaw | 0.2 /100 | #255 | Tragic 36.3% |
| Immigrants | Trinidad and Tobago | 0.2 /100 | #256 | Tragic 36.3% |
| Immigrants | Grenada | 0.2 /100 | #257 | Tragic 36.3% |
| Americans | 0.2 /100 | #258 | Tragic 36.4% |
| Immigrants | El Salvador | 0.2 /100 | #259 | Tragic 36.4% |
| Ottawa | 0.2 /100 | #260 | Tragic 36.5% |
| Trinidadians and Tobagonians | 0.2 /100 | #261 | Tragic 36.5% |
| French American Indians | 0.1 /100 | #262 | Tragic 36.6% |
| Nicaraguans | 0.1 /100 | #263 | Tragic 36.6% |
| Sub-Saharan Africans | 0.1 /100 | #264 | Tragic 36.7% |
| Cherokee | 0.1 /100 | #265 | Tragic 36.7% |
| Immigrants | Senegal | 0.1 /100 | #266 | Tragic 36.7% |
| Central Americans | 0.1 /100 | #267 | Tragic 36.7% |
| Comanche | 0.1 /100 | #268 | Tragic 36.7% |
| Senegalese | 0.1 /100 | #269 | Tragic 36.8% |
| Immigrants | Congo | 0.1 /100 | #270 | Tragic 36.8% |
| Immigrants | Barbados | 0.1 /100 | #271 | Tragic 36.8% |
| Choctaw | 0.1 /100 | #272 | Tragic 36.9% |