Immigrants from Uzbekistan vs American Births to Unmarried Women
COMPARE
Immigrants from Uzbekistan
American
Births to Unmarried Women
Births to Unmarried Women Comparison
Immigrants from Uzbekistan
Americans
25.8%
BIRTHS TO UNMARRIED WOMEN
100.0/ 100
METRIC RATING
17th/ 347
METRIC RANK
36.4%
BIRTHS TO UNMARRIED WOMEN
0.2/ 100
METRIC RATING
258th/ 347
METRIC RANK
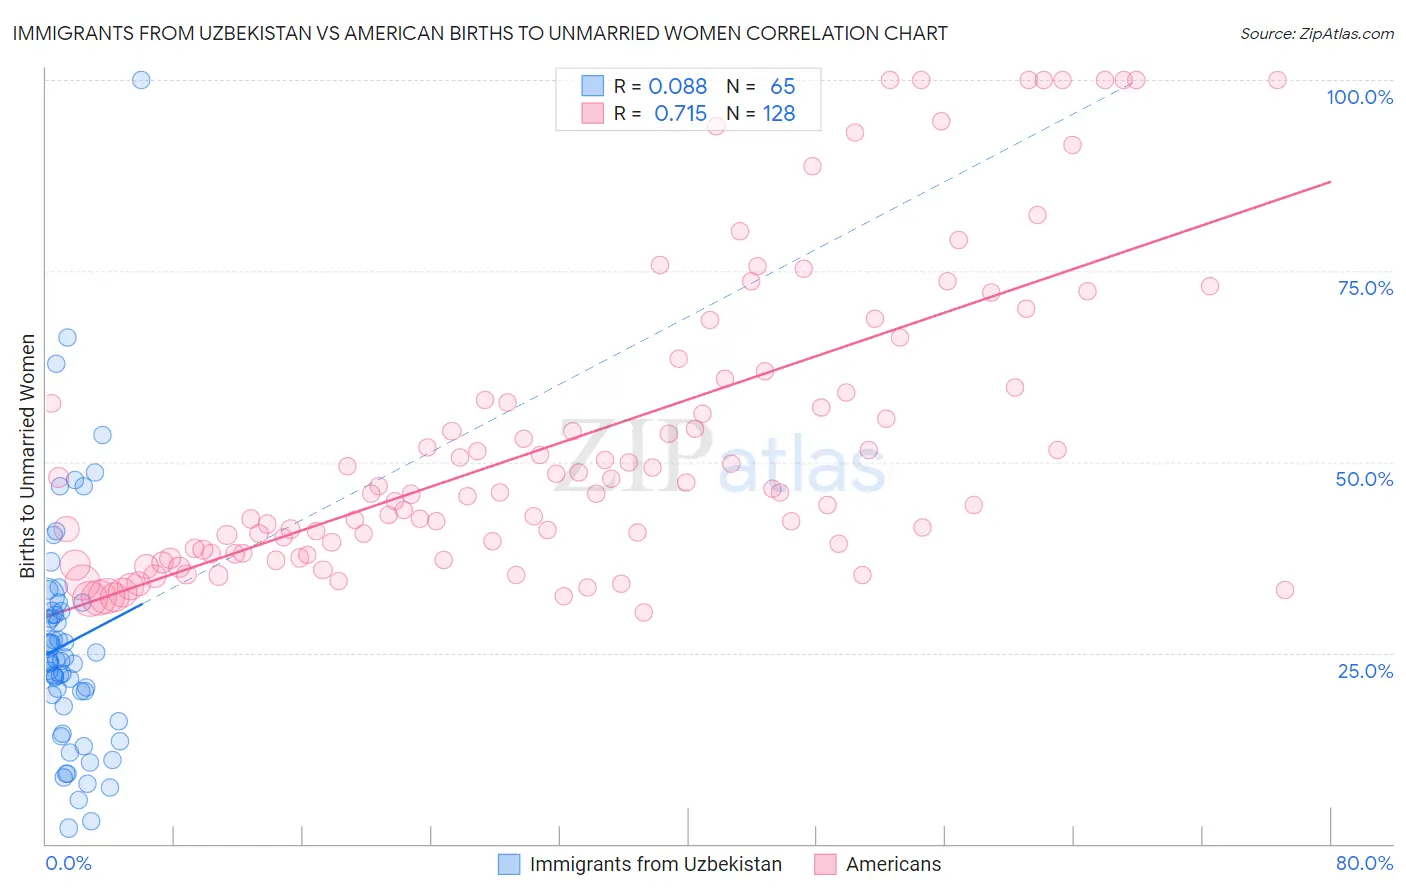
Immigrants from Uzbekistan vs American Births to Unmarried Women Correlation Chart
The statistical analysis conducted on geographies consisting of 114,110,355 people shows a slight positive correlation between the proportion of Immigrants from Uzbekistan and percentage of births to unmarried women in the United States with a correlation coefficient (R) of 0.088 and weighted average of 25.8%. Similarly, the statistical analysis conducted on geographies consisting of 512,571,138 people shows a strong positive correlation between the proportion of Americans and percentage of births to unmarried women in the United States with a correlation coefficient (R) of 0.715 and weighted average of 36.4%, a difference of 41.2%.
Births to Unmarried Women Correlation Summary
| Measurement | Immigrants from Uzbekistan | American |
| Minimum | 2.0% | 30.2% |
| Maximum | 100.0% | 100.0% |
| Range | 98.0% | 69.8% |
| Mean | 26.3% | 53.1% |
| Median | 23.9% | 46.0% |
| Interquartile 25% (IQ1) | 17.0% | 38.3% |
| Interquartile 75% (IQ3) | 31.0% | 60.3% |
| Interquartile Range (IQR) | 14.0% | 22.0% |
| Standard Deviation (Sample) | 16.2% | 19.8% |
| Standard Deviation (Population) | 16.0% | 19.7% |
Similar Demographics by Births to Unmarried Women
Demographics Similar to Immigrants from Uzbekistan by Births to Unmarried Women
In terms of births to unmarried women, the demographic groups most similar to Immigrants from Uzbekistan are Immigrants from Belarus (25.6%, a difference of 0.57%), Immigrants from Singapore (25.6%, a difference of 0.62%), Immigrants from Armenia (26.1%, a difference of 1.1%), Armenian (26.2%, a difference of 1.7%), and Immigrants from Lebanon (25.3%, a difference of 1.8%).
| Demographics | Rating | Rank | Births to Unmarried Women |
| Immigrants | Eastern Asia | 100.0 /100 | #10 | Exceptional 25.0% |
| Immigrants | Israel | 100.0 /100 | #11 | Exceptional 25.1% |
| Indians (Asian) | 100.0 /100 | #12 | Exceptional 25.3% |
| Iranians | 100.0 /100 | #13 | Exceptional 25.3% |
| Immigrants | Lebanon | 100.0 /100 | #14 | Exceptional 25.3% |
| Immigrants | Singapore | 100.0 /100 | #15 | Exceptional 25.6% |
| Immigrants | Belarus | 100.0 /100 | #16 | Exceptional 25.6% |
| Immigrants | Uzbekistan | 100.0 /100 | #17 | Exceptional 25.8% |
| Immigrants | Armenia | 99.9 /100 | #18 | Exceptional 26.1% |
| Armenians | 99.9 /100 | #19 | Exceptional 26.2% |
| Immigrants | Korea | 99.9 /100 | #20 | Exceptional 26.3% |
| Soviet Union | 99.9 /100 | #21 | Exceptional 26.3% |
| Burmese | 99.9 /100 | #22 | Exceptional 26.4% |
| Immigrants | Japan | 99.9 /100 | #23 | Exceptional 26.4% |
| Immigrants | Australia | 99.9 /100 | #24 | Exceptional 26.6% |
Demographics Similar to Americans by Births to Unmarried Women
In terms of births to unmarried women, the demographic groups most similar to Americans are Immigrants from El Salvador (36.4%, a difference of 0.050%), Ottawa (36.5%, a difference of 0.16%), Trinidadian and Tobagonian (36.5%, a difference of 0.17%), Immigrants from Grenada (36.3%, a difference of 0.28%), and Chickasaw (36.3%, a difference of 0.31%).
| Demographics | Rating | Rank | Births to Unmarried Women |
| Immigrants | Western Africa | 0.3 /100 | #251 | Tragic 36.0% |
| Salvadorans | 0.3 /100 | #252 | Tragic 36.0% |
| Immigrants | Portugal | 0.2 /100 | #253 | Tragic 36.2% |
| Potawatomi | 0.2 /100 | #254 | Tragic 36.2% |
| Chickasaw | 0.2 /100 | #255 | Tragic 36.3% |
| Immigrants | Trinidad and Tobago | 0.2 /100 | #256 | Tragic 36.3% |
| Immigrants | Grenada | 0.2 /100 | #257 | Tragic 36.3% |
| Americans | 0.2 /100 | #258 | Tragic 36.4% |
| Immigrants | El Salvador | 0.2 /100 | #259 | Tragic 36.4% |
| Ottawa | 0.2 /100 | #260 | Tragic 36.5% |
| Trinidadians and Tobagonians | 0.2 /100 | #261 | Tragic 36.5% |
| French American Indians | 0.1 /100 | #262 | Tragic 36.6% |
| Nicaraguans | 0.1 /100 | #263 | Tragic 36.6% |
| Sub-Saharan Africans | 0.1 /100 | #264 | Tragic 36.7% |
| Cherokee | 0.1 /100 | #265 | Tragic 36.7% |