Korean vs Immigrants from Belgium Divorced or Separated
COMPARE
Korean
Immigrants from Belgium
Divorced or Separated
Divorced or Separated Comparison
Koreans
Immigrants from Belgium
11.3%
DIVORCED OR SEPARATED
99.9/ 100
METRIC RATING
61st/ 347
METRIC RANK
11.5%
DIVORCED OR SEPARATED
99.7/ 100
METRIC RATING
69th/ 347
METRIC RANK
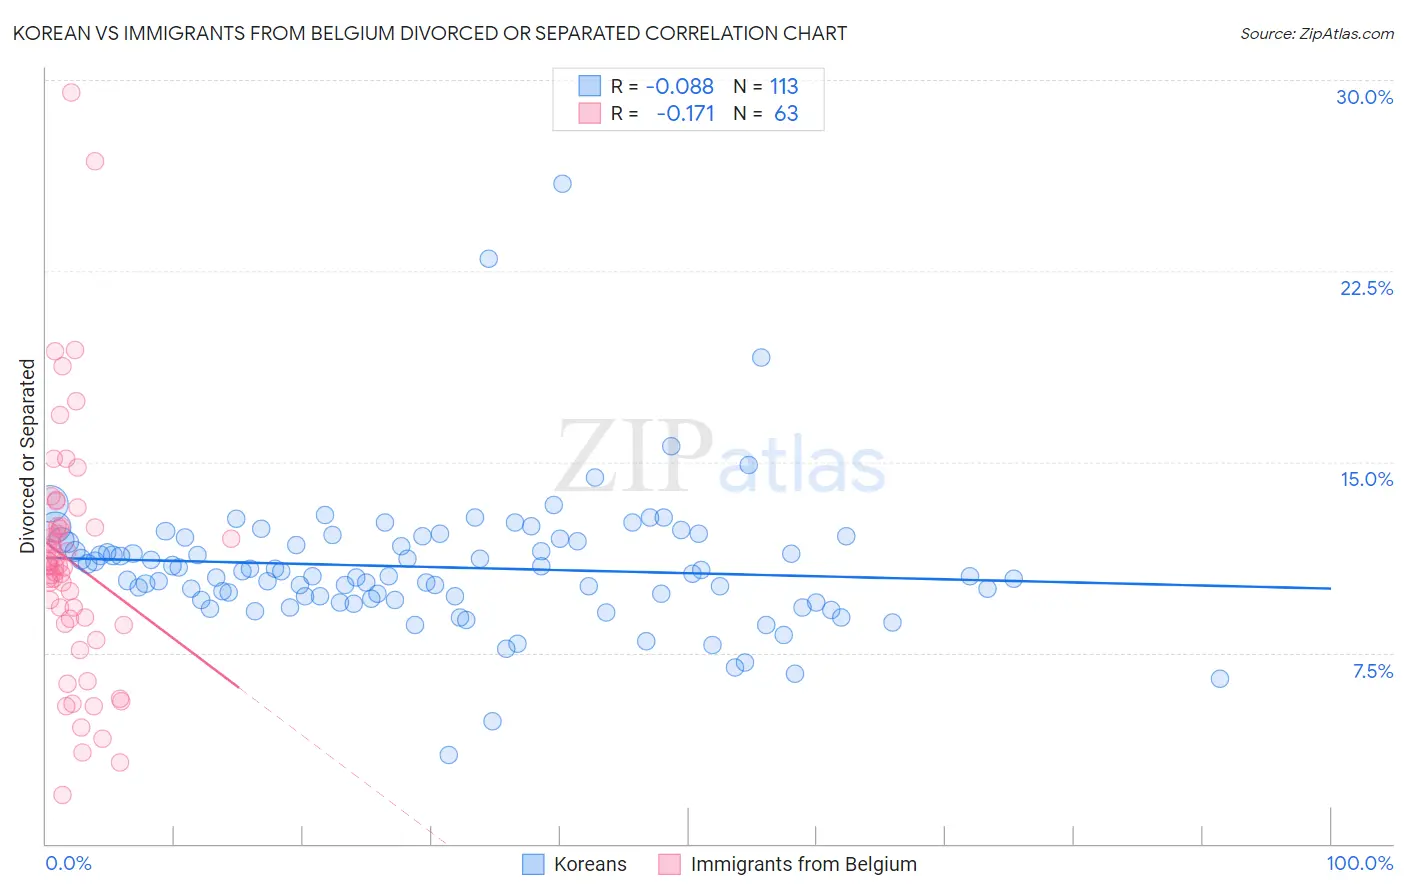
Korean vs Immigrants from Belgium Divorced or Separated Correlation Chart
The statistical analysis conducted on geographies consisting of 510,579,810 people shows a slight negative correlation between the proportion of Koreans and percentage of population currently divorced or separated in the United States with a correlation coefficient (R) of -0.088 and weighted average of 11.3%. Similarly, the statistical analysis conducted on geographies consisting of 146,701,736 people shows a poor negative correlation between the proportion of Immigrants from Belgium and percentage of population currently divorced or separated in the United States with a correlation coefficient (R) of -0.171 and weighted average of 11.5%, a difference of 0.90%.
Divorced or Separated Correlation Summary
| Measurement | Korean | Immigrants from Belgium |
| Minimum | 3.5% | 1.9% |
| Maximum | 25.9% | 29.5% |
| Range | 22.4% | 27.6% |
| Mean | 10.9% | 11.1% |
| Median | 10.6% | 10.9% |
| Interquartile 25% (IQ1) | 9.6% | 8.6% |
| Interquartile 75% (IQ3) | 12.0% | 12.5% |
| Interquartile Range (IQR) | 2.4% | 3.8% |
| Standard Deviation (Sample) | 2.7% | 4.9% |
| Standard Deviation (Population) | 2.7% | 4.9% |
Demographics Similar to Koreans and Immigrants from Belgium by Divorced or Separated
In terms of divorced or separated, the demographic groups most similar to Koreans are Luxembourger (11.3%, a difference of 0.0%), Immigrants from Russia (11.3%, a difference of 0.010%), Immigrants from Kuwait (11.3%, a difference of 0.010%), Israeli (11.3%, a difference of 0.17%), and Sri Lankan (11.3%, a difference of 0.26%). Similarly, the demographic groups most similar to Immigrants from Belgium are Palestinian (11.5%, a difference of 0.0%), Immigrants from Eastern Europe (11.5%, a difference of 0.010%), Immigrants from Syria (11.4%, a difference of 0.11%), Paraguayan (11.5%, a difference of 0.11%), and Jordanian (11.5%, a difference of 0.17%).
| Demographics | Rating | Rank | Divorced or Separated |
| Immigrants | Yemen | 99.9 /100 | #55 | Exceptional 11.3% |
| Immigrants | Philippines | 99.9 /100 | #56 | Exceptional 11.3% |
| Immigrants | Vietnam | 99.9 /100 | #57 | Exceptional 11.3% |
| Sri Lankans | 99.9 /100 | #58 | Exceptional 11.3% |
| Israelis | 99.9 /100 | #59 | Exceptional 11.3% |
| Immigrants | Russia | 99.9 /100 | #60 | Exceptional 11.3% |
| Koreans | 99.9 /100 | #61 | Exceptional 11.3% |
| Luxembourgers | 99.9 /100 | #62 | Exceptional 11.3% |
| Immigrants | Kuwait | 99.9 /100 | #63 | Exceptional 11.3% |
| Macedonians | 99.8 /100 | #64 | Exceptional 11.4% |
| Immigrants | South Eastern Asia | 99.8 /100 | #65 | Exceptional 11.4% |
| Inupiat | 99.8 /100 | #66 | Exceptional 11.4% |
| Immigrants | Syria | 99.7 /100 | #67 | Exceptional 11.4% |
| Palestinians | 99.7 /100 | #68 | Exceptional 11.5% |
| Immigrants | Belgium | 99.7 /100 | #69 | Exceptional 11.5% |
| Immigrants | Eastern Europe | 99.7 /100 | #70 | Exceptional 11.5% |
| Paraguayans | 99.7 /100 | #71 | Exceptional 11.5% |
| Jordanians | 99.6 /100 | #72 | Exceptional 11.5% |
| Immigrants | North Macedonia | 99.6 /100 | #73 | Exceptional 11.5% |
| Taiwanese | 99.6 /100 | #74 | Exceptional 11.5% |
| Immigrants | Northern Africa | 99.6 /100 | #75 | Exceptional 11.5% |