Korean vs British Divorced or Separated
COMPARE
Korean
British
Divorced or Separated
Divorced or Separated Comparison
Koreans
British
11.3%
DIVORCED OR SEPARATED
99.9/ 100
METRIC RATING
61st/ 347
METRIC RANK
12.3%
DIVORCED OR SEPARATED
11.6/ 100
METRIC RATING
220th/ 347
METRIC RANK
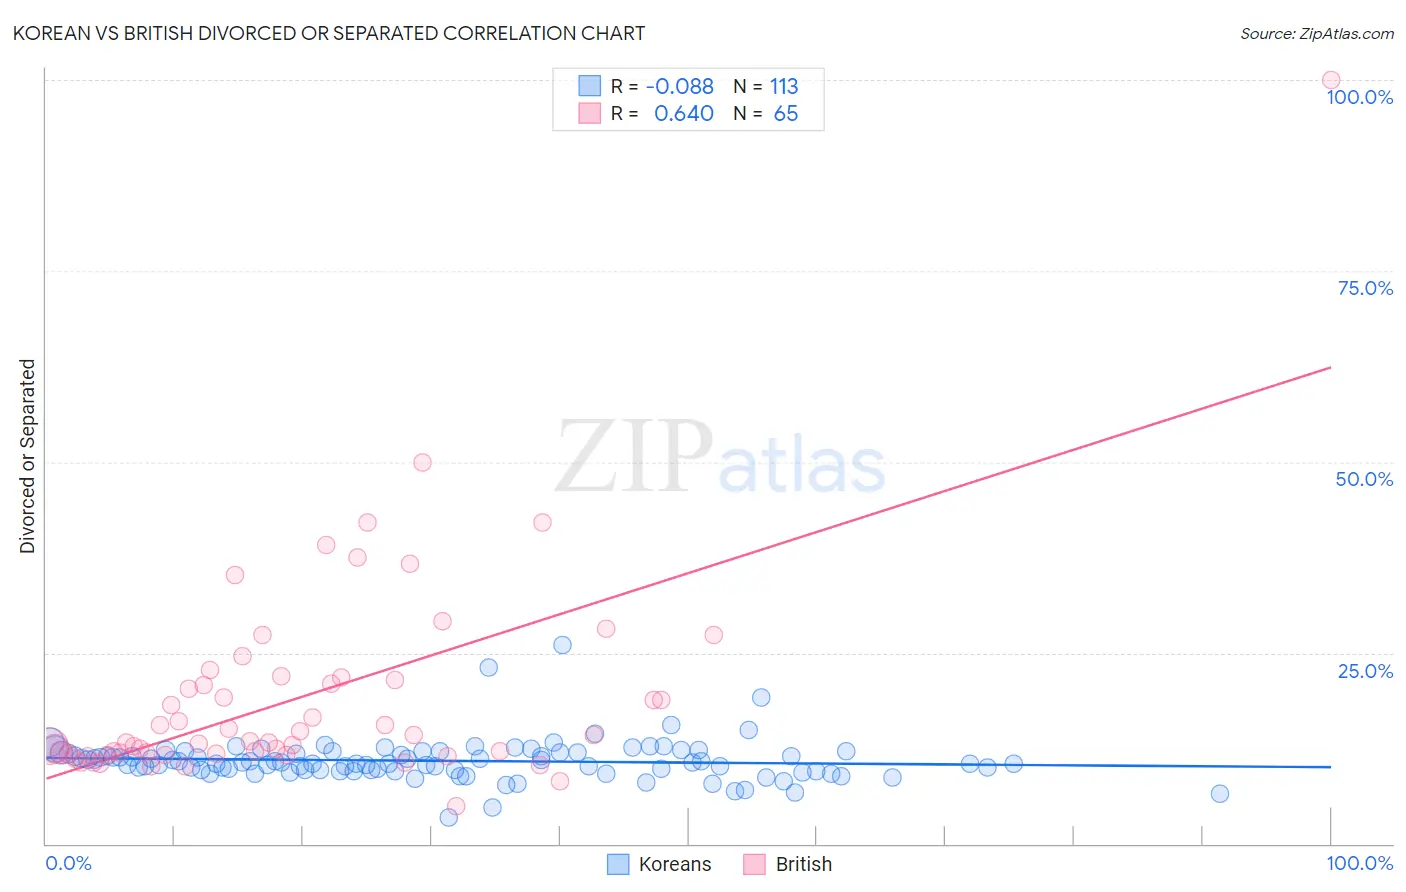
Korean vs British Divorced or Separated Correlation Chart
The statistical analysis conducted on geographies consisting of 510,579,810 people shows a slight negative correlation between the proportion of Koreans and percentage of population currently divorced or separated in the United States with a correlation coefficient (R) of -0.088 and weighted average of 11.3%. Similarly, the statistical analysis conducted on geographies consisting of 531,128,127 people shows a significant positive correlation between the proportion of British and percentage of population currently divorced or separated in the United States with a correlation coefficient (R) of 0.640 and weighted average of 12.3%, a difference of 8.1%.
Divorced or Separated Correlation Summary
| Measurement | Korean | British |
| Minimum | 3.5% | 4.9% |
| Maximum | 25.9% | 100.0% |
| Range | 22.4% | 95.1% |
| Mean | 10.9% | 19.2% |
| Median | 10.6% | 13.4% |
| Interquartile 25% (IQ1) | 9.6% | 11.8% |
| Interquartile 75% (IQ3) | 12.0% | 21.6% |
| Interquartile Range (IQR) | 2.4% | 9.8% |
| Standard Deviation (Sample) | 2.7% | 13.9% |
| Standard Deviation (Population) | 2.7% | 13.8% |
Similar Demographics by Divorced or Separated
Demographics Similar to Koreans by Divorced or Separated
In terms of divorced or separated, the demographic groups most similar to Koreans are Luxembourger (11.3%, a difference of 0.0%), Immigrants from Russia (11.3%, a difference of 0.010%), Immigrants from Kuwait (11.3%, a difference of 0.010%), Israeli (11.3%, a difference of 0.17%), and Sri Lankan (11.3%, a difference of 0.26%).
| Demographics | Rating | Rank | Divorced or Separated |
| Eastern Europeans | 99.9 /100 | #54 | Exceptional 11.3% |
| Immigrants | Yemen | 99.9 /100 | #55 | Exceptional 11.3% |
| Immigrants | Philippines | 99.9 /100 | #56 | Exceptional 11.3% |
| Immigrants | Vietnam | 99.9 /100 | #57 | Exceptional 11.3% |
| Sri Lankans | 99.9 /100 | #58 | Exceptional 11.3% |
| Israelis | 99.9 /100 | #59 | Exceptional 11.3% |
| Immigrants | Russia | 99.9 /100 | #60 | Exceptional 11.3% |
| Koreans | 99.9 /100 | #61 | Exceptional 11.3% |
| Luxembourgers | 99.9 /100 | #62 | Exceptional 11.3% |
| Immigrants | Kuwait | 99.9 /100 | #63 | Exceptional 11.3% |
| Macedonians | 99.8 /100 | #64 | Exceptional 11.4% |
| Immigrants | South Eastern Asia | 99.8 /100 | #65 | Exceptional 11.4% |
| Inupiat | 99.8 /100 | #66 | Exceptional 11.4% |
| Immigrants | Syria | 99.7 /100 | #67 | Exceptional 11.4% |
| Palestinians | 99.7 /100 | #68 | Exceptional 11.5% |
Demographics Similar to British by Divorced or Separated
In terms of divorced or separated, the demographic groups most similar to British are Czechoslovakian (12.3%, a difference of 0.010%), Guamanian/Chamorro (12.3%, a difference of 0.030%), Bangladeshi (12.3%, a difference of 0.10%), Scandinavian (12.3%, a difference of 0.11%), and Slovene (12.3%, a difference of 0.12%).
| Demographics | Rating | Rank | Divorced or Separated |
| Immigrants | Eastern Africa | 16.2 /100 | #213 | Poor 12.2% |
| Immigrants | Argentina | 15.5 /100 | #214 | Poor 12.2% |
| Europeans | 15.4 /100 | #215 | Poor 12.2% |
| Immigrants | South America | 15.4 /100 | #216 | Poor 12.2% |
| Northern Europeans | 14.7 /100 | #217 | Poor 12.2% |
| Slovenes | 13.2 /100 | #218 | Poor 12.3% |
| Czechoslovakians | 11.7 /100 | #219 | Poor 12.3% |
| British | 11.6 /100 | #220 | Poor 12.3% |
| Guamanians/Chamorros | 11.3 /100 | #221 | Poor 12.3% |
| Bangladeshis | 10.5 /100 | #222 | Poor 12.3% |
| Scandinavians | 10.4 /100 | #223 | Poor 12.3% |
| Immigrants | Azores | 9.7 /100 | #224 | Tragic 12.3% |
| Belgians | 9.7 /100 | #225 | Tragic 12.3% |
| Immigrants | Western Africa | 9.3 /100 | #226 | Tragic 12.3% |
| Hmong | 8.8 /100 | #227 | Tragic 12.3% |