Korean vs Immigrants from Uruguay Divorced or Separated
COMPARE
Korean
Immigrants from Uruguay
Divorced or Separated
Divorced or Separated Comparison
Koreans
Immigrants from Uruguay
11.3%
DIVORCED OR SEPARATED
99.9/ 100
METRIC RATING
61st/ 347
METRIC RANK
12.6%
DIVORCED OR SEPARATED
0.6/ 100
METRIC RATING
260th/ 347
METRIC RANK
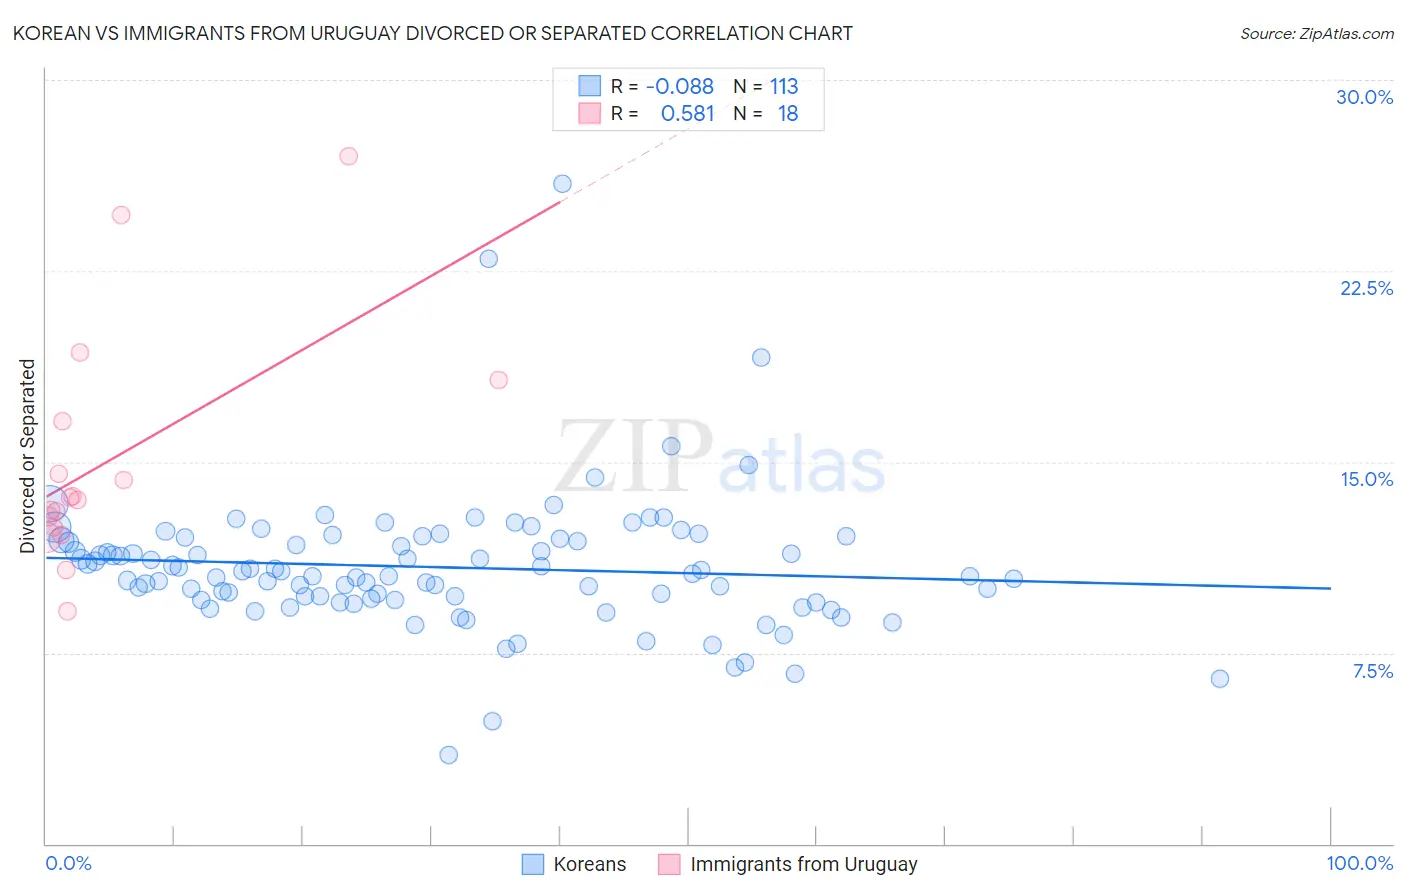
Korean vs Immigrants from Uruguay Divorced or Separated Correlation Chart
The statistical analysis conducted on geographies consisting of 510,579,810 people shows a slight negative correlation between the proportion of Koreans and percentage of population currently divorced or separated in the United States with a correlation coefficient (R) of -0.088 and weighted average of 11.3%. Similarly, the statistical analysis conducted on geographies consisting of 133,250,872 people shows a substantial positive correlation between the proportion of Immigrants from Uruguay and percentage of population currently divorced or separated in the United States with a correlation coefficient (R) of 0.581 and weighted average of 12.6%, a difference of 11.0%.
Divorced or Separated Correlation Summary
| Measurement | Korean | Immigrants from Uruguay |
| Minimum | 3.5% | 9.2% |
| Maximum | 25.9% | 27.0% |
| Range | 22.4% | 17.8% |
| Mean | 10.9% | 15.0% |
| Median | 10.6% | 13.6% |
| Interquartile 25% (IQ1) | 9.6% | 12.4% |
| Interquartile 75% (IQ3) | 12.0% | 16.6% |
| Interquartile Range (IQR) | 2.4% | 4.2% |
| Standard Deviation (Sample) | 2.7% | 4.6% |
| Standard Deviation (Population) | 2.7% | 4.5% |
Similar Demographics by Divorced or Separated
Demographics Similar to Koreans by Divorced or Separated
In terms of divorced or separated, the demographic groups most similar to Koreans are Luxembourger (11.3%, a difference of 0.0%), Immigrants from Russia (11.3%, a difference of 0.010%), Immigrants from Kuwait (11.3%, a difference of 0.010%), Israeli (11.3%, a difference of 0.17%), and Sri Lankan (11.3%, a difference of 0.26%).
| Demographics | Rating | Rank | Divorced or Separated |
| Eastern Europeans | 99.9 /100 | #54 | Exceptional 11.3% |
| Immigrants | Yemen | 99.9 /100 | #55 | Exceptional 11.3% |
| Immigrants | Philippines | 99.9 /100 | #56 | Exceptional 11.3% |
| Immigrants | Vietnam | 99.9 /100 | #57 | Exceptional 11.3% |
| Sri Lankans | 99.9 /100 | #58 | Exceptional 11.3% |
| Israelis | 99.9 /100 | #59 | Exceptional 11.3% |
| Immigrants | Russia | 99.9 /100 | #60 | Exceptional 11.3% |
| Koreans | 99.9 /100 | #61 | Exceptional 11.3% |
| Luxembourgers | 99.9 /100 | #62 | Exceptional 11.3% |
| Immigrants | Kuwait | 99.9 /100 | #63 | Exceptional 11.3% |
| Macedonians | 99.8 /100 | #64 | Exceptional 11.4% |
| Immigrants | South Eastern Asia | 99.8 /100 | #65 | Exceptional 11.4% |
| Inupiat | 99.8 /100 | #66 | Exceptional 11.4% |
| Immigrants | Syria | 99.7 /100 | #67 | Exceptional 11.4% |
| Palestinians | 99.7 /100 | #68 | Exceptional 11.5% |
Demographics Similar to Immigrants from Uruguay by Divorced or Separated
In terms of divorced or separated, the demographic groups most similar to Immigrants from Uruguay are Yuman (12.6%, a difference of 0.0%), Immigrants from Somalia (12.6%, a difference of 0.020%), Indonesian (12.6%, a difference of 0.020%), Immigrants from Dominica (12.6%, a difference of 0.030%), and Immigrants from Colombia (12.6%, a difference of 0.040%).
| Demographics | Rating | Rank | Divorced or Separated |
| Somalis | 0.9 /100 | #253 | Tragic 12.6% |
| Senegalese | 0.8 /100 | #254 | Tragic 12.6% |
| Welsh | 0.7 /100 | #255 | Tragic 12.6% |
| Immigrants | Colombia | 0.6 /100 | #256 | Tragic 12.6% |
| Immigrants | Somalia | 0.6 /100 | #257 | Tragic 12.6% |
| Indonesians | 0.6 /100 | #258 | Tragic 12.6% |
| Yuman | 0.6 /100 | #259 | Tragic 12.6% |
| Immigrants | Uruguay | 0.6 /100 | #260 | Tragic 12.6% |
| Immigrants | Dominica | 0.5 /100 | #261 | Tragic 12.6% |
| Basques | 0.5 /100 | #262 | Tragic 12.6% |
| Immigrants | Panama | 0.5 /100 | #263 | Tragic 12.6% |
| English | 0.5 /100 | #264 | Tragic 12.6% |
| Immigrants | Senegal | 0.5 /100 | #265 | Tragic 12.6% |
| Whites/Caucasians | 0.5 /100 | #266 | Tragic 12.6% |
| Scottish | 0.4 /100 | #267 | Tragic 12.6% |