Korean vs Nicaraguan Divorced or Separated
COMPARE
Korean
Nicaraguan
Divorced or Separated
Divorced or Separated Comparison
Koreans
Nicaraguans
11.3%
DIVORCED OR SEPARATED
99.9/ 100
METRIC RATING
61st/ 347
METRIC RANK
13.0%
DIVORCED OR SEPARATED
0.0/ 100
METRIC RATING
296th/ 347
METRIC RANK
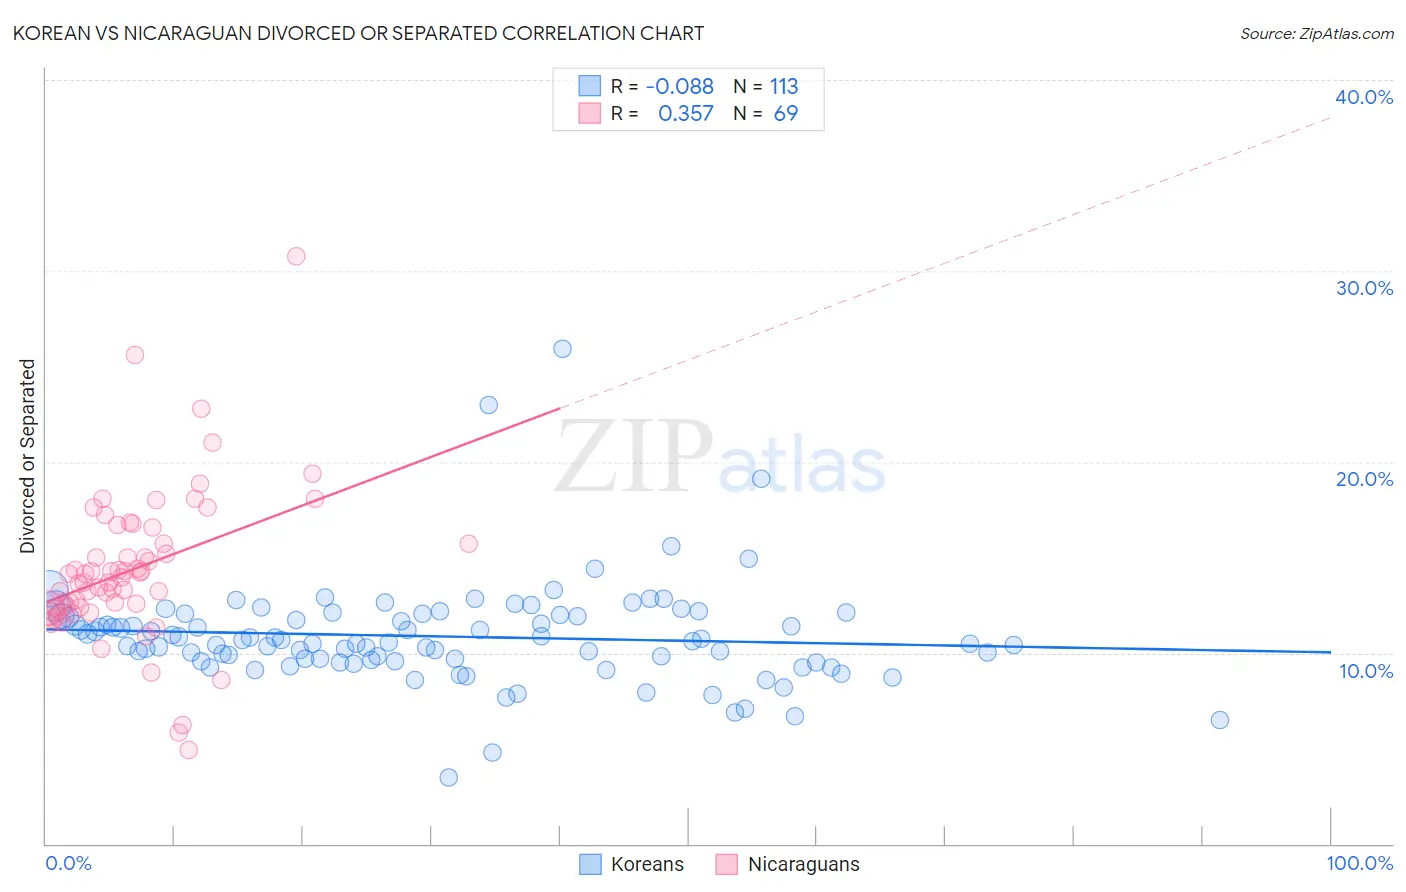
Korean vs Nicaraguan Divorced or Separated Correlation Chart
The statistical analysis conducted on geographies consisting of 510,579,810 people shows a slight negative correlation between the proportion of Koreans and percentage of population currently divorced or separated in the United States with a correlation coefficient (R) of -0.088 and weighted average of 11.3%. Similarly, the statistical analysis conducted on geographies consisting of 285,619,743 people shows a mild positive correlation between the proportion of Nicaraguans and percentage of population currently divorced or separated in the United States with a correlation coefficient (R) of 0.357 and weighted average of 13.0%, a difference of 14.6%.
Divorced or Separated Correlation Summary
| Measurement | Korean | Nicaraguan |
| Minimum | 3.5% | 4.9% |
| Maximum | 25.9% | 30.8% |
| Range | 22.4% | 25.9% |
| Mean | 10.9% | 14.3% |
| Median | 10.6% | 13.9% |
| Interquartile 25% (IQ1) | 9.6% | 12.4% |
| Interquartile 75% (IQ3) | 12.0% | 16.1% |
| Interquartile Range (IQR) | 2.4% | 3.8% |
| Standard Deviation (Sample) | 2.7% | 4.0% |
| Standard Deviation (Population) | 2.7% | 4.0% |
Similar Demographics by Divorced or Separated
Demographics Similar to Koreans by Divorced or Separated
In terms of divorced or separated, the demographic groups most similar to Koreans are Luxembourger (11.3%, a difference of 0.0%), Immigrants from Russia (11.3%, a difference of 0.010%), Immigrants from Kuwait (11.3%, a difference of 0.010%), Israeli (11.3%, a difference of 0.17%), and Sri Lankan (11.3%, a difference of 0.26%).
| Demographics | Rating | Rank | Divorced or Separated |
| Eastern Europeans | 99.9 /100 | #54 | Exceptional 11.3% |
| Immigrants | Yemen | 99.9 /100 | #55 | Exceptional 11.3% |
| Immigrants | Philippines | 99.9 /100 | #56 | Exceptional 11.3% |
| Immigrants | Vietnam | 99.9 /100 | #57 | Exceptional 11.3% |
| Sri Lankans | 99.9 /100 | #58 | Exceptional 11.3% |
| Israelis | 99.9 /100 | #59 | Exceptional 11.3% |
| Immigrants | Russia | 99.9 /100 | #60 | Exceptional 11.3% |
| Koreans | 99.9 /100 | #61 | Exceptional 11.3% |
| Luxembourgers | 99.9 /100 | #62 | Exceptional 11.3% |
| Immigrants | Kuwait | 99.9 /100 | #63 | Exceptional 11.3% |
| Macedonians | 99.8 /100 | #64 | Exceptional 11.4% |
| Immigrants | South Eastern Asia | 99.8 /100 | #65 | Exceptional 11.4% |
| Inupiat | 99.8 /100 | #66 | Exceptional 11.4% |
| Immigrants | Syria | 99.7 /100 | #67 | Exceptional 11.4% |
| Palestinians | 99.7 /100 | #68 | Exceptional 11.5% |
Demographics Similar to Nicaraguans by Divorced or Separated
In terms of divorced or separated, the demographic groups most similar to Nicaraguans are Native/Alaskan (13.0%, a difference of 0.050%), Venezuelan (13.0%, a difference of 0.12%), Immigrants from Jamaica (13.0%, a difference of 0.16%), Celtic (13.0%, a difference of 0.41%), and Apache (12.9%, a difference of 0.54%).
| Demographics | Rating | Rank | Divorced or Separated |
| Iroquois | 0.0 /100 | #289 | Tragic 12.9% |
| Pima | 0.0 /100 | #290 | Tragic 12.9% |
| Immigrants | Honduras | 0.0 /100 | #291 | Tragic 12.9% |
| Scotch-Irish | 0.0 /100 | #292 | Tragic 12.9% |
| Jamaicans | 0.0 /100 | #293 | Tragic 12.9% |
| Apache | 0.0 /100 | #294 | Tragic 12.9% |
| Celtics | 0.0 /100 | #295 | Tragic 13.0% |
| Nicaraguans | 0.0 /100 | #296 | Tragic 13.0% |
| Natives/Alaskans | 0.0 /100 | #297 | Tragic 13.0% |
| Venezuelans | 0.0 /100 | #298 | Tragic 13.0% |
| Immigrants | Jamaica | 0.0 /100 | #299 | Tragic 13.0% |
| Immigrants | Cabo Verde | 0.0 /100 | #300 | Tragic 13.1% |
| Alaskan Athabascans | 0.0 /100 | #301 | Tragic 13.1% |
| Immigrants | Venezuela | 0.0 /100 | #302 | Tragic 13.1% |
| Cape Verdeans | 0.0 /100 | #303 | Tragic 13.1% |