Korean vs Danish Divorced or Separated
COMPARE
Korean
Danish
Divorced or Separated
Divorced or Separated Comparison
Koreans
Danes
11.3%
DIVORCED OR SEPARATED
99.9/ 100
METRIC RATING
61st/ 347
METRIC RANK
11.9%
DIVORCED OR SEPARATED
84.8/ 100
METRIC RATING
135th/ 347
METRIC RANK
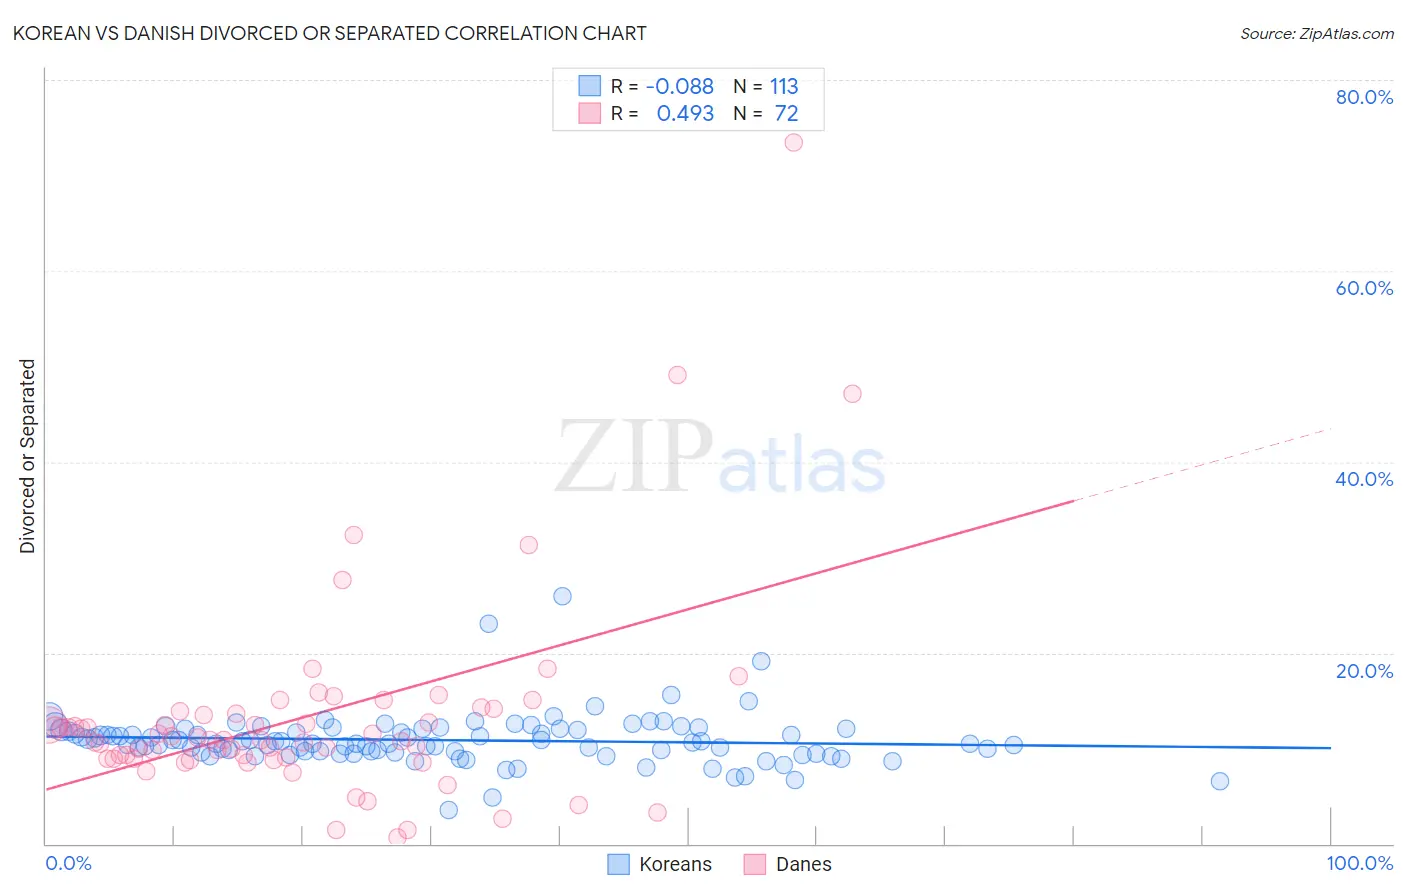
Korean vs Danish Divorced or Separated Correlation Chart
The statistical analysis conducted on geographies consisting of 510,579,810 people shows a slight negative correlation between the proportion of Koreans and percentage of population currently divorced or separated in the United States with a correlation coefficient (R) of -0.088 and weighted average of 11.3%. Similarly, the statistical analysis conducted on geographies consisting of 473,966,187 people shows a moderate positive correlation between the proportion of Danes and percentage of population currently divorced or separated in the United States with a correlation coefficient (R) of 0.493 and weighted average of 11.9%, a difference of 4.7%.
Divorced or Separated Correlation Summary
| Measurement | Korean | Danish |
| Minimum | 3.5% | 0.70% |
| Maximum | 25.9% | 73.4% |
| Range | 22.4% | 72.7% |
| Mean | 10.9% | 13.2% |
| Median | 10.6% | 10.9% |
| Interquartile 25% (IQ1) | 9.6% | 8.9% |
| Interquartile 75% (IQ3) | 12.0% | 13.8% |
| Interquartile Range (IQR) | 2.4% | 4.8% |
| Standard Deviation (Sample) | 2.7% | 10.9% |
| Standard Deviation (Population) | 2.7% | 10.8% |
Similar Demographics by Divorced or Separated
Demographics Similar to Koreans by Divorced or Separated
In terms of divorced or separated, the demographic groups most similar to Koreans are Luxembourger (11.3%, a difference of 0.0%), Immigrants from Russia (11.3%, a difference of 0.010%), Immigrants from Kuwait (11.3%, a difference of 0.010%), Israeli (11.3%, a difference of 0.17%), and Sri Lankan (11.3%, a difference of 0.26%).
| Demographics | Rating | Rank | Divorced or Separated |
| Eastern Europeans | 99.9 /100 | #54 | Exceptional 11.3% |
| Immigrants | Yemen | 99.9 /100 | #55 | Exceptional 11.3% |
| Immigrants | Philippines | 99.9 /100 | #56 | Exceptional 11.3% |
| Immigrants | Vietnam | 99.9 /100 | #57 | Exceptional 11.3% |
| Sri Lankans | 99.9 /100 | #58 | Exceptional 11.3% |
| Israelis | 99.9 /100 | #59 | Exceptional 11.3% |
| Immigrants | Russia | 99.9 /100 | #60 | Exceptional 11.3% |
| Koreans | 99.9 /100 | #61 | Exceptional 11.3% |
| Luxembourgers | 99.9 /100 | #62 | Exceptional 11.3% |
| Immigrants | Kuwait | 99.9 /100 | #63 | Exceptional 11.3% |
| Macedonians | 99.8 /100 | #64 | Exceptional 11.4% |
| Immigrants | South Eastern Asia | 99.8 /100 | #65 | Exceptional 11.4% |
| Inupiat | 99.8 /100 | #66 | Exceptional 11.4% |
| Immigrants | Syria | 99.7 /100 | #67 | Exceptional 11.4% |
| Palestinians | 99.7 /100 | #68 | Exceptional 11.5% |
Demographics Similar to Danes by Divorced or Separated
In terms of divorced or separated, the demographic groups most similar to Danes are Carpatho Rusyn (11.9%, a difference of 0.0%), Argentinean (11.9%, a difference of 0.020%), Alsatian (11.9%, a difference of 0.060%), Immigrants from Netherlands (11.9%, a difference of 0.060%), and Australian (11.9%, a difference of 0.080%).
| Demographics | Rating | Rank | Divorced or Separated |
| Immigrants | Ecuador | 88.9 /100 | #128 | Excellent 11.8% |
| Immigrants | St. Vincent and the Grenadines | 88.4 /100 | #129 | Excellent 11.8% |
| Immigrants | Austria | 88.2 /100 | #130 | Excellent 11.8% |
| Immigrants | Cambodia | 88.2 /100 | #131 | Excellent 11.8% |
| Immigrants | Afghanistan | 87.9 /100 | #132 | Excellent 11.8% |
| New Zealanders | 87.5 /100 | #133 | Excellent 11.9% |
| Argentineans | 85.1 /100 | #134 | Excellent 11.9% |
| Danes | 84.8 /100 | #135 | Excellent 11.9% |
| Carpatho Rusyns | 84.8 /100 | #136 | Excellent 11.9% |
| Alsatians | 84.0 /100 | #137 | Excellent 11.9% |
| Immigrants | Netherlands | 83.9 /100 | #138 | Excellent 11.9% |
| Australians | 83.6 /100 | #139 | Excellent 11.9% |
| Lebanese | 83.4 /100 | #140 | Excellent 11.9% |
| Immigrants | Morocco | 82.9 /100 | #141 | Excellent 11.9% |
| Immigrants | Zimbabwe | 81.5 /100 | #142 | Excellent 11.9% |