Korean vs Central American Indian Divorced or Separated
COMPARE
Korean
Central American Indian
Divorced or Separated
Divorced or Separated Comparison
Koreans
Central American Indians
11.3%
DIVORCED OR SEPARATED
99.9/ 100
METRIC RATING
61st/ 347
METRIC RANK
12.7%
DIVORCED OR SEPARATED
0.3/ 100
METRIC RATING
275th/ 347
METRIC RANK
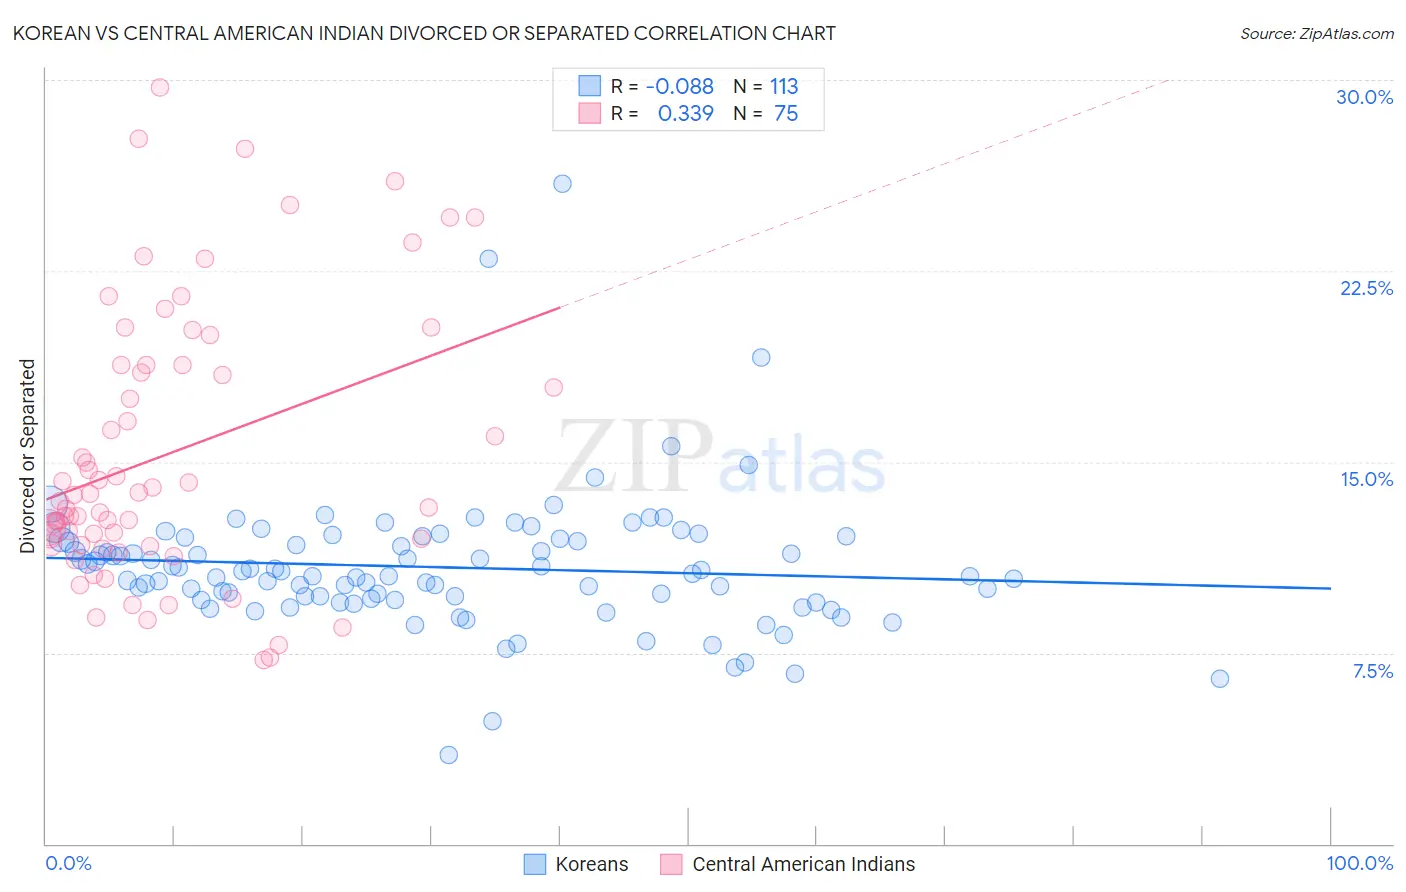
Korean vs Central American Indian Divorced or Separated Correlation Chart
The statistical analysis conducted on geographies consisting of 510,579,810 people shows a slight negative correlation between the proportion of Koreans and percentage of population currently divorced or separated in the United States with a correlation coefficient (R) of -0.088 and weighted average of 11.3%. Similarly, the statistical analysis conducted on geographies consisting of 326,087,171 people shows a mild positive correlation between the proportion of Central American Indians and percentage of population currently divorced or separated in the United States with a correlation coefficient (R) of 0.339 and weighted average of 12.7%, a difference of 11.7%.
Divorced or Separated Correlation Summary
| Measurement | Korean | Central American Indian |
| Minimum | 3.5% | 7.2% |
| Maximum | 25.9% | 29.7% |
| Range | 22.4% | 22.5% |
| Mean | 10.9% | 15.3% |
| Median | 10.6% | 13.7% |
| Interquartile 25% (IQ1) | 9.6% | 11.7% |
| Interquartile 75% (IQ3) | 12.0% | 18.8% |
| Interquartile Range (IQR) | 2.4% | 7.1% |
| Standard Deviation (Sample) | 2.7% | 5.3% |
| Standard Deviation (Population) | 2.7% | 5.3% |
Similar Demographics by Divorced or Separated
Demographics Similar to Koreans by Divorced or Separated
In terms of divorced or separated, the demographic groups most similar to Koreans are Luxembourger (11.3%, a difference of 0.0%), Immigrants from Russia (11.3%, a difference of 0.010%), Immigrants from Kuwait (11.3%, a difference of 0.010%), Israeli (11.3%, a difference of 0.17%), and Sri Lankan (11.3%, a difference of 0.26%).
| Demographics | Rating | Rank | Divorced or Separated |
| Eastern Europeans | 99.9 /100 | #54 | Exceptional 11.3% |
| Immigrants | Yemen | 99.9 /100 | #55 | Exceptional 11.3% |
| Immigrants | Philippines | 99.9 /100 | #56 | Exceptional 11.3% |
| Immigrants | Vietnam | 99.9 /100 | #57 | Exceptional 11.3% |
| Sri Lankans | 99.9 /100 | #58 | Exceptional 11.3% |
| Israelis | 99.9 /100 | #59 | Exceptional 11.3% |
| Immigrants | Russia | 99.9 /100 | #60 | Exceptional 11.3% |
| Koreans | 99.9 /100 | #61 | Exceptional 11.3% |
| Luxembourgers | 99.9 /100 | #62 | Exceptional 11.3% |
| Immigrants | Kuwait | 99.9 /100 | #63 | Exceptional 11.3% |
| Macedonians | 99.8 /100 | #64 | Exceptional 11.4% |
| Immigrants | South Eastern Asia | 99.8 /100 | #65 | Exceptional 11.4% |
| Inupiat | 99.8 /100 | #66 | Exceptional 11.4% |
| Immigrants | Syria | 99.7 /100 | #67 | Exceptional 11.4% |
| Palestinians | 99.7 /100 | #68 | Exceptional 11.5% |
Demographics Similar to Central American Indians by Divorced or Separated
In terms of divorced or separated, the demographic groups most similar to Central American Indians are Bermudan (12.7%, a difference of 0.020%), Immigrants from Micronesia (12.7%, a difference of 0.040%), Spaniard (12.7%, a difference of 0.060%), Dominican (12.7%, a difference of 0.11%), and Immigrants from Middle Africa (12.7%, a difference of 0.16%).
| Demographics | Rating | Rank | Divorced or Separated |
| Fijians | 0.4 /100 | #268 | Tragic 12.6% |
| Immigrants | Liberia | 0.4 /100 | #269 | Tragic 12.6% |
| Ute | 0.4 /100 | #270 | Tragic 12.6% |
| Panamanians | 0.3 /100 | #271 | Tragic 12.7% |
| Immigrants | Middle Africa | 0.3 /100 | #272 | Tragic 12.7% |
| Immigrants | Micronesia | 0.3 /100 | #273 | Tragic 12.7% |
| Bermudans | 0.3 /100 | #274 | Tragic 12.7% |
| Central American Indians | 0.3 /100 | #275 | Tragic 12.7% |
| Spaniards | 0.2 /100 | #276 | Tragic 12.7% |
| Dominicans | 0.2 /100 | #277 | Tragic 12.7% |
| Lumbee | 0.2 /100 | #278 | Tragic 12.7% |
| Immigrants | Dominican Republic | 0.2 /100 | #279 | Tragic 12.7% |
| Immigrants | Zaire | 0.2 /100 | #280 | Tragic 12.7% |
| Pueblo | 0.2 /100 | #281 | Tragic 12.7% |
| Sub-Saharan Africans | 0.1 /100 | #282 | Tragic 12.7% |