Ukrainian vs Yup'ik Currently Married
COMPARE
Ukrainian
Yup'ik
Currently Married
Currently Married Comparison
Ukrainians
Yup'ik
48.4%
CURRENTLY MARRIED
98.3/ 100
METRIC RATING
65th/ 347
METRIC RANK
39.9%
CURRENTLY MARRIED
0.0/ 100
METRIC RATING
333rd/ 347
METRIC RANK
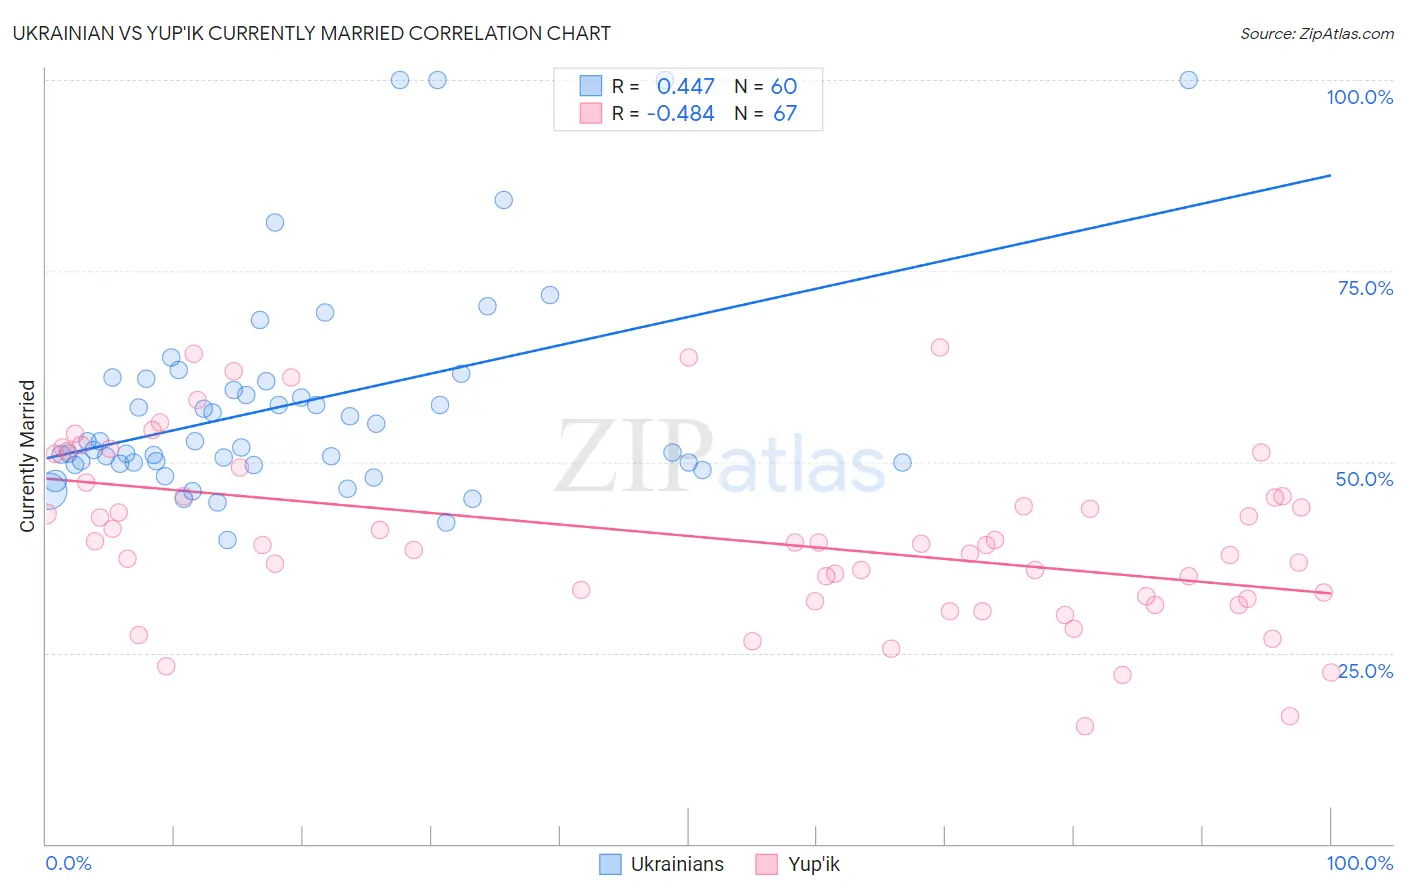
Ukrainian vs Yup'ik Currently Married Correlation Chart
The statistical analysis conducted on geographies consisting of 448,616,463 people shows a moderate positive correlation between the proportion of Ukrainians and percentage of population currently married in the United States with a correlation coefficient (R) of 0.447 and weighted average of 48.4%. Similarly, the statistical analysis conducted on geographies consisting of 39,963,234 people shows a moderate negative correlation between the proportion of Yup'ik and percentage of population currently married in the United States with a correlation coefficient (R) of -0.484 and weighted average of 39.9%, a difference of 21.2%.
Currently Married Correlation Summary
| Measurement | Ukrainian | Yup'ik |
| Minimum | 39.7% | 15.4% |
| Maximum | 100.0% | 65.0% |
| Range | 60.3% | 49.6% |
| Mean | 57.7% | 40.2% |
| Median | 52.3% | 39.2% |
| Interquartile 25% (IQ1) | 49.9% | 32.1% |
| Interquartile 75% (IQ3) | 60.7% | 47.3% |
| Interquartile Range (IQR) | 10.8% | 15.2% |
| Standard Deviation (Sample) | 14.2% | 11.4% |
| Standard Deviation (Population) | 14.1% | 11.3% |
Similar Demographics by Currently Married
Demographics Similar to Ukrainians by Currently Married
In terms of currently married, the demographic groups most similar to Ukrainians are Slavic (48.4%, a difference of 0.010%), Immigrants from Czechoslovakia (48.4%, a difference of 0.010%), Tongan (48.3%, a difference of 0.030%), Slovak (48.3%, a difference of 0.040%), and Immigrants from England (48.3%, a difference of 0.050%).
| Demographics | Rating | Rank | Currently Married |
| French | 98.6 /100 | #58 | Exceptional 48.4% |
| Immigrants | Ireland | 98.5 /100 | #59 | Exceptional 48.4% |
| Immigrants | Romania | 98.5 /100 | #60 | Exceptional 48.4% |
| Romanians | 98.5 /100 | #61 | Exceptional 48.4% |
| Asians | 98.5 /100 | #62 | Exceptional 48.4% |
| Slavs | 98.3 /100 | #63 | Exceptional 48.4% |
| Immigrants | Czechoslovakia | 98.3 /100 | #64 | Exceptional 48.4% |
| Ukrainians | 98.3 /100 | #65 | Exceptional 48.4% |
| Tongans | 98.2 /100 | #66 | Exceptional 48.3% |
| Slovaks | 98.2 /100 | #67 | Exceptional 48.3% |
| Immigrants | England | 98.2 /100 | #68 | Exceptional 48.3% |
| Canadians | 98.1 /100 | #69 | Exceptional 48.3% |
| Immigrants | Asia | 97.9 /100 | #70 | Exceptional 48.3% |
| Macedonians | 97.9 /100 | #71 | Exceptional 48.3% |
| Immigrants | Lebanon | 97.6 /100 | #72 | Exceptional 48.2% |
Demographics Similar to Yup'ik by Currently Married
In terms of currently married, the demographic groups most similar to Yup'ik are Puerto Rican (39.9%, a difference of 0.010%), Lumbee (39.8%, a difference of 0.18%), British West Indian (39.8%, a difference of 0.35%), Immigrants from St. Vincent and the Grenadines (40.1%, a difference of 0.39%), and Black/African American (39.6%, a difference of 0.73%).
| Demographics | Rating | Rank | Currently Married |
| Barbadians | 0.0 /100 | #326 | Tragic 40.6% |
| Senegalese | 0.0 /100 | #327 | Tragic 40.6% |
| Arapaho | 0.0 /100 | #328 | Tragic 40.5% |
| Crow | 0.0 /100 | #329 | Tragic 40.4% |
| Immigrants | Dominica | 0.0 /100 | #330 | Tragic 40.3% |
| Immigrants | Barbados | 0.0 /100 | #331 | Tragic 40.3% |
| Immigrants | St. Vincent and the Grenadines | 0.0 /100 | #332 | Tragic 40.1% |
| Yup'ik | 0.0 /100 | #333 | Tragic 39.9% |
| Puerto Ricans | 0.0 /100 | #334 | Tragic 39.9% |
| Lumbee | 0.0 /100 | #335 | Tragic 39.8% |
| British West Indians | 0.0 /100 | #336 | Tragic 39.8% |
| Blacks/African Americans | 0.0 /100 | #337 | Tragic 39.6% |
| Cape Verdeans | 0.0 /100 | #338 | Tragic 39.6% |
| Dominicans | 0.0 /100 | #339 | Tragic 39.5% |
| Immigrants | Grenada | 0.0 /100 | #340 | Tragic 39.1% |