Jordanian vs Yup'ik Female Poverty Among 18-24 Year Olds

COMPARE

Jordanian
Race
Ancestry
AfghanAfricanAlaska NativeAlaskan AthabascanAlbanianAleutAlsatianAmericanApacheArabArapahoArgentineanArmenianAssyrian/Chaldean/SyriacAustralianAustrianBahamianBangladeshiBarbadianBasqueBelgianBelizeanBermudanBhutaneseBlackfeetBolivianBrazilianBritishBritish West IndianBulgarianBurmeseCajunCambodianCanadianCape VerdeanCarpatho RusynCelticCentral AmericanCentral American IndianCherokeeCheyenneChickasawChileanChineseChippewaChoctawColombianColvilleComancheCosta RicanCreeCreekCroatianCrowCubanCypriotCzechCzechoslovakianDanishDelawareDominicanDutchDutch West IndianEastern EuropeanEcuadorianEgyptianEnglishEstonianEthiopianEuropeanFijianFilipinoFinnishFrenchFrench American IndianFrench CanadianGermanGerman RussianGhanaianGreekGuamanian/ChamorroGuatemalanGuyaneseHaitianHmongHonduranHopiHoumaHungarianIcelanderIndian (Asian)IndonesianInupiatIranianIraqiIrishIroquoisIsraeliItalianJamaicanJapaneseJordanianKenyanKiowaKoreanLaotianLatvianLebaneseLiberianLithuanianLumbeeLuxembourgerMacedonianMalaysianMalteseMarshalleseMenomineeMexicanMexican American IndianMongolianMoroccanNative HawaiianNavajoNepaleseNew ZealanderNicaraguanNigerianNorthern EuropeanNorwegianOkinawanOsageOttawaPaiutePakistaniPalestinianPanamanianParaguayanPennsylvania GermanPeruvianPimaPolishPortuguesePotawatomiPuebloPuerto RicanPuget Sound SalishRomanianRussianSalvadoranSamoanScandinavianScotch-IrishScottishSeminoleSenegaleseSerbianShoshoneSierra LeoneanSiouxSlavicSlovakSloveneSomaliSouth AfricanSouth AmericanSouth American IndianSoviet UnionSpaniardSpanishSpanish AmericanSpanish American IndianSri LankanSubsaharan AfricanSudaneseSwedishSwissSyrianTaiwaneseThaiTlingit-HaidaTohono O'OdhamTonganTrinidadian and TobagonianTsimshianTurkishU.S. Virgin IslanderUgandanUkrainianUruguayanUteVenezuelanVietnameseWelshWest IndianYakamaYaquiYugoslavianYumanZimbabwean
Immigration
NonimmigrantsImmigrantsAfghanistanAfricaAlbaniaArgentinaArmeniaAsiaAustraliaAustriaBahamasBangladeshBarbadosBelarusBelgiumBelizeBoliviaBosnia and HerzegovinaBrazilBulgariaBurma/MyanmarCabo VerdeCambodiaCameroonCanadaCaribbeanCentral AmericaChileChinaColombiaCongoCosta RicaCroatiaCubaCzechoslovakiaDenmarkDominicaDominican RepublicEastern AfricaEastern AsiaEastern EuropeEcuadorEgyptEl SalvadorEnglandEritreaEthiopiaEuropeFijiFranceGermanyGhanaGreeceGrenadaGuatemalaGuyanaHaitiHondurasHong KongHungaryIndiaIndonesiaIranIraqIrelandIsraelItalyJamaicaJapanJordanKazakhstanKenyaKoreaKuwaitLaosLatin AmericaLatviaLebanonLiberiaLithuaniaMalaysiaMexicoMicronesiaMiddle AfricaMoldovaMoroccoNepalNetherlandsNicaraguaNigeriaNorth AmericaNorth MacedoniaNorthern AfricaNorthern EuropeNorwayOceaniaPakistanPanamaPeruPhilippinesPolandPortugalRomaniaRussiaSaudi ArabiaScotlandSenegalSerbiaSierra LeoneSingaporeSomaliaSouth AfricaSouth AmericaSouth Central AsiaSouth Eastern AsiaSouthern EuropeSpainSri LankaSt. Vincent and the GrenadinesSudanSwedenSwitzerlandSyriaTaiwanThailandTrinidad and TobagoTurkeyUgandaUkraineUruguayUzbekistanVenezuelaVietnamWest IndiesWestern AfricaWestern AsiaWestern EuropeYemenZaireZimbabweAzores
Yup'ik
Race
Ancestry
AfghanAfricanAlaska NativeAlaskan AthabascanAlbanianAleutAlsatianAmericanApacheArabArapahoArgentineanArmenianAssyrian/Chaldean/SyriacAustralianAustrianBahamianBangladeshiBarbadianBasqueBelgianBelizeanBermudanBhutaneseBlackfeetBolivianBrazilianBritishBritish West IndianBulgarianBurmeseCajunCambodianCanadianCape VerdeanCarpatho RusynCelticCentral AmericanCentral American IndianCherokeeCheyenneChickasawChileanChineseChippewaChoctawColombianColvilleComancheCosta RicanCreeCreekCroatianCrowCubanCypriotCzechCzechoslovakianDanishDelawareDominicanDutchDutch West IndianEastern EuropeanEcuadorianEgyptianEnglishEstonianEthiopianEuropeanFijianFilipinoFinnishFrenchFrench American IndianFrench CanadianGermanGerman RussianGhanaianGreekGuamanian/ChamorroGuatemalanGuyaneseHaitianHmongHonduranHopiHoumaHungarianIcelanderIndian (Asian)IndonesianInupiatIranianIraqiIrishIroquoisIsraeliItalianJamaicanJapaneseKenyanKiowaKoreanLaotianLatvianLebaneseLiberianLithuanianLumbeeLuxembourgerMacedonianMalaysianMalteseMarshalleseMenomineeMexicanMexican American IndianMongolianMoroccanNative HawaiianNavajoNepaleseNew ZealanderNicaraguanNigerianNorthern EuropeanNorwegianOkinawanOsageOttawaPaiutePakistaniPalestinianPanamanianParaguayanPennsylvania GermanPeruvianPimaPolishPortuguesePotawatomiPuebloPuerto RicanPuget Sound SalishRomanianRussianSalvadoranSamoanScandinavianScotch-IrishScottishSeminoleSenegaleseSerbianShoshoneSierra LeoneanSiouxSlavicSlovakSloveneSomaliSouth AfricanSouth AmericanSouth American IndianSoviet UnionSpaniardSpanishSpanish AmericanSpanish American IndianSri LankanSubsaharan AfricanSudaneseSwedishSwissSyrianTaiwaneseThaiTlingit-HaidaTohono O'OdhamTonganTrinidadian and TobagonianTsimshianTurkishU.S. Virgin IslanderUgandanUkrainianUruguayanUteVenezuelanVietnameseWelshWest IndianYakamaYaquiYugoslavianYumanYup'ikZimbabwean
Immigration
NonimmigrantsImmigrantsAfghanistanAfricaAlbaniaArgentinaArmeniaAsiaAustraliaAustriaBahamasBangladeshBarbadosBelarusBelgiumBelizeBoliviaBosnia and HerzegovinaBrazilBulgariaBurma/MyanmarCabo VerdeCambodiaCameroonCanadaCaribbeanCentral AmericaChileChinaColombiaCongoCosta RicaCroatiaCubaCzechoslovakiaDenmarkDominicaDominican RepublicEastern AfricaEastern AsiaEastern EuropeEcuadorEgyptEl SalvadorEnglandEritreaEthiopiaEuropeFijiFranceGermanyGhanaGreeceGrenadaGuatemalaGuyanaHaitiHondurasHong KongHungaryIndiaIndonesiaIranIraqIrelandIsraelItalyJamaicaJapanJordanKazakhstanKenyaKoreaKuwaitLaosLatin AmericaLatviaLebanonLiberiaLithuaniaMalaysiaMexicoMicronesiaMiddle AfricaMoldovaMoroccoNepalNetherlandsNicaraguaNigeriaNorth AmericaNorth MacedoniaNorthern AfricaNorthern EuropeNorwayOceaniaPakistanPanamaPeruPhilippinesPolandPortugalRomaniaRussiaSaudi ArabiaScotlandSenegalSerbiaSierra LeoneSingaporeSomaliaSouth AfricaSouth AmericaSouth Central AsiaSouth Eastern AsiaSouthern EuropeSpainSri LankaSt. Vincent and the GrenadinesSudanSwedenSwitzerlandSyriaTaiwanThailandTrinidad and TobagoTurkeyUgandaUkraineUruguayUzbekistanVenezuelaVietnamWest IndiesWestern AfricaWestern AsiaWestern EuropeYemenZaireZimbabweAzores
Female Poverty Among 18-24 Year Olds
Income
Poverty
Unemployment
Labor Participation
Family Structure
Vehicle Availability
Education Level
Disability

Female Poverty Among 18-24 Year Olds Comparison

Jordanians

Yup'ik

Exceptional
Tragic
18.6%
FEMALE POVERTY AMONG 18-24 YEAR OLDS
99.8/ 100
METRIC RATING
66th/ 347
METRIC RANK
27.0%
FEMALE POVERTY AMONG 18-24 YEAR OLDS
0.0/ 100
METRIC RATING
335th/ 347
METRIC RANK

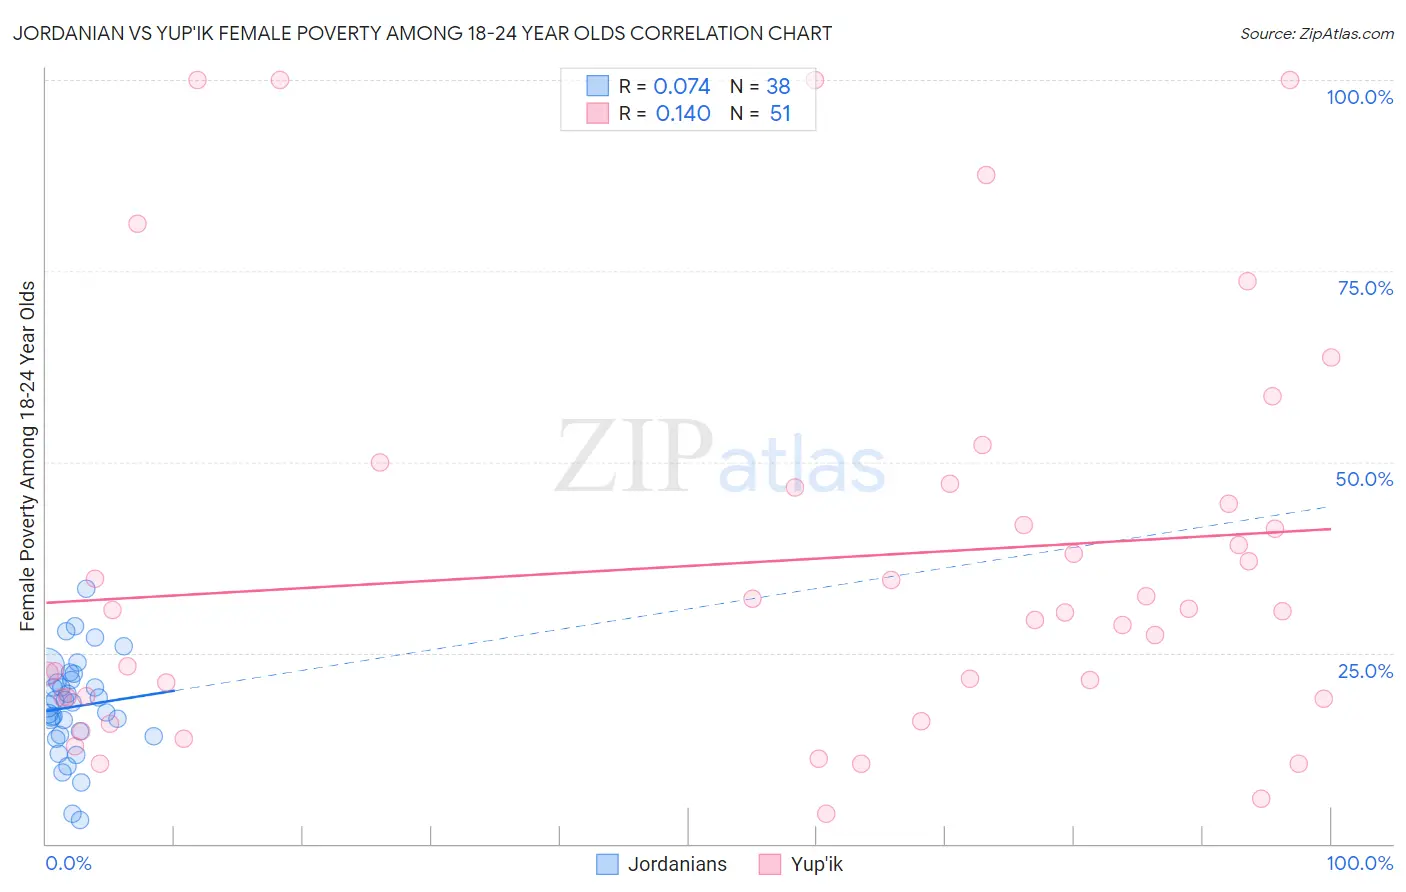
Jordanian vs Yup'ik Female Poverty Among 18-24 Year Olds Correlation Chart

The statistical analysis conducted on geographies consisting of 165,137,509 people shows a slight positive correlation between the proportion of Jordanians and poverty level among females between the ages 18 and 24 in the United States with a correlation coefficient (R) of 0.074 and weighted average of 18.6%. Similarly, the statistical analysis conducted on geographies consisting of 39,755,694 people shows a poor positive correlation between the proportion of Yup'ik and poverty level among females between the ages 18 and 24 in the United States with a correlation coefficient (R) of 0.140 and weighted average of 27.0%, a difference of 45.4%.
Jordanian vs Yup'ik Female Poverty Among 18-24 Year Olds

Female Poverty Among 18-24 Year Olds Correlation Summary

MeasurementJordanianYup'ik
Minimum3.1%4.0%
Maximum33.3%100.0%
Range30.2%96.0%
Mean17.9%36.8%
Median18.2%30.5%
Interquartile 25% (IQ1)14.2%19.2%
Interquartile 75% (IQ3)21.4%46.7%
Interquartile Range (IQR)7.2%27.5%
Standard Deviation (Sample)6.4%26.1%
Standard Deviation (Population)6.4%25.8%

Similar Demographics by Female Poverty Among 18-24 Year Olds

Demographics Similar to Jordanians by Female Poverty Among 18-24 Year Olds

In terms of female poverty among 18-24 year olds, the demographic groups most similar to Jordanians are Immigrants from Scotland (18.6%, a difference of 0.17%), Immigrants from Korea (18.6%, a difference of 0.17%), Immigrants from Asia (18.6%, a difference of 0.20%), Brazilian (18.6%, a difference of 0.21%), and Immigrants from Belarus (18.5%, a difference of 0.23%).
DemographicsRating | RankFemale Poverty Among 18-24 Year Olds
Egyptians
99.9
/100
|
#59
Exceptional
18.5%
Immigrants | Brazil
99.8
/100
|
#60
Exceptional
18.5%
Immigrants | Albania
99.8
/100
|
#61
Exceptional
18.5%
Greeks
99.8
/100
|
#62
Exceptional
18.5%
Immigrants | Belarus
99.8
/100
|
#63
Exceptional
18.5%
Immigrants | Asia
99.8
/100
|
#64
Exceptional
18.6%
Immigrants | Scotland
99.8
/100
|
#65
Exceptional
18.6%
Jordanians
99.8
/100
|
#66
Exceptional
18.6%
Immigrants | Korea
99.8
/100
|
#67
Exceptional
18.6%
Brazilians
99.8
/100
|
#68
Exceptional
18.6%
Immigrants | Bulgaria
99.7
/100
|
#69
Exceptional
18.6%
Immigrants | Costa Rica
99.7
/100
|
#70
Exceptional
18.7%
Immigrants | Haiti
99.7
/100
|
#71
Exceptional
18.7%
Armenians
99.7
/100
|
#72
Exceptional
18.7%
Lithuanians
99.7
/100
|
#73
Exceptional
18.7%

Demographics Similar to Yup'ik by Female Poverty Among 18-24 Year Olds

In terms of female poverty among 18-24 year olds, the demographic groups most similar to Yup'ik are Pueblo (26.9%, a difference of 0.45%), Immigrants from Yemen (27.5%, a difference of 1.9%), Apache (26.3%, a difference of 2.7%), Houma (26.2%, a difference of 3.2%), and Cheyenne (28.1%, a difference of 4.2%).
DemographicsRating | RankFemale Poverty Among 18-24 Year Olds
Natives/Alaskans
0.0
/100
|
#328
Tragic
25.4%
Cajuns
0.0
/100
|
#329
Tragic
25.7%
Immigrants | Somalia
0.0
/100
|
#330
Tragic
25.7%
Chippewa
0.0
/100
|
#331
Tragic
25.9%
Houma
0.0
/100
|
#332
Tragic
26.2%
Apache
0.0
/100
|
#333
Tragic
26.3%
Pueblo
0.0
/100
|
#334
Tragic
26.9%
Yup'ik
0.0
/100
|
#335
Tragic
27.0%
Immigrants | Yemen
0.0
/100
|
#336
Tragic
27.5%
Cheyenne
0.0
/100
|
#337
Tragic
28.1%
Hopi
0.0
/100
|
#338
Tragic
28.2%
Pima
0.0
/100
|
#339
Tragic
28.4%
Sioux
0.0
/100
|
#340
Tragic
28.6%
Colville
0.0
/100
|
#341
Tragic
29.0%
Kiowa
0.0
/100
|
#342
Tragic
29.2%