Jordanian vs Yup'ik Median Family Income
COMPARE
Jordanian
Yup'ik
Median Family Income
Median Family Income Comparison
Jordanians
Yup'ik
$109,865
MEDIAN FAMILY INCOME
97.5/ 100
METRIC RATING
97th/ 347
METRIC RANK
$79,290
MEDIAN FAMILY INCOME
0.0/ 100
METRIC RATING
335th/ 347
METRIC RANK
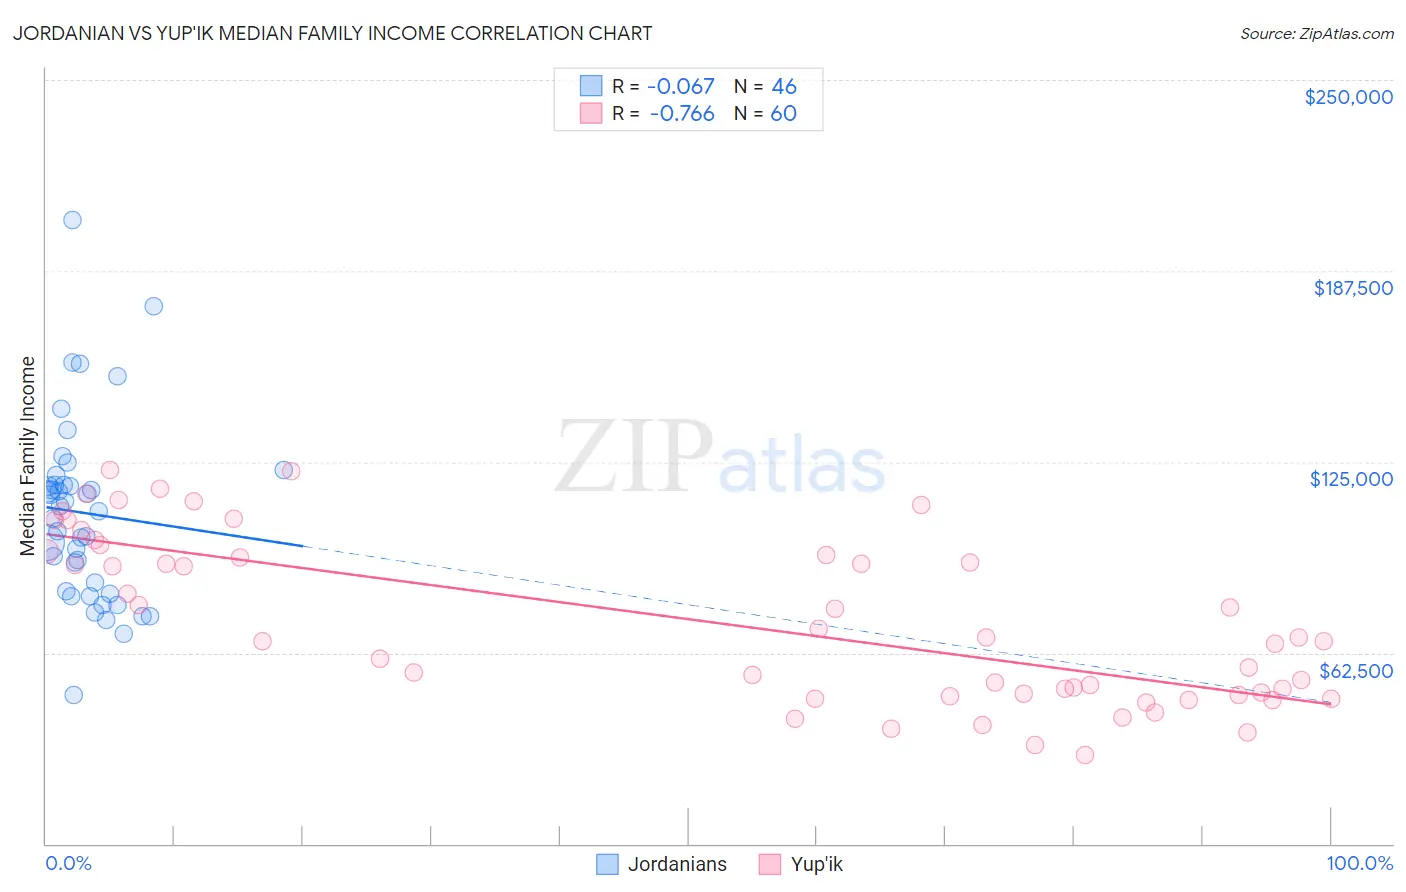
Jordanian vs Yup'ik Median Family Income Correlation Chart
The statistical analysis conducted on geographies consisting of 166,350,373 people shows a slight negative correlation between the proportion of Jordanians and median family income in the United States with a correlation coefficient (R) of -0.067 and weighted average of $109,865. Similarly, the statistical analysis conducted on geographies consisting of 39,952,310 people shows a strong negative correlation between the proportion of Yup'ik and median family income in the United States with a correlation coefficient (R) of -0.766 and weighted average of $79,290, a difference of 38.6%.
Median Family Income Correlation Summary
| Measurement | Jordanian | Yup'ik |
| Minimum | $48,661 | $29,250 |
| Maximum | $204,272 | $122,399 |
| Range | $155,611 | $93,149 |
| Mean | $108,250 | $72,637 |
| Median | $109,650 | $66,875 |
| Interquartile 25% (IQ1) | $82,841 | $48,824 |
| Interquartile 75% (IQ3) | $117,365 | $95,045 |
| Interquartile Range (IQR) | $34,524 | $46,221 |
| Standard Deviation (Sample) | $29,858 | $27,024 |
| Standard Deviation (Population) | $29,532 | $26,798 |
Similar Demographics by Median Family Income
Demographics Similar to Jordanians by Median Family Income
In terms of median family income, the demographic groups most similar to Jordanians are Immigrants from Moldova ($109,975, a difference of 0.10%), Immigrants from Kuwait ($109,731, a difference of 0.12%), Zimbabwean ($110,011, a difference of 0.13%), Armenian ($109,692, a difference of 0.16%), and Macedonian ($109,668, a difference of 0.18%).
| Demographics | Rating | Rank | Median Family Income |
| Northern Europeans | 98.3 /100 | #90 | Exceptional $110,635 |
| Immigrants | Southern Europe | 98.3 /100 | #91 | Exceptional $110,614 |
| Immigrants | Lebanon | 97.9 /100 | #92 | Exceptional $110,159 |
| Immigrants | Kazakhstan | 97.8 /100 | #93 | Exceptional $110,137 |
| Koreans | 97.8 /100 | #94 | Exceptional $110,103 |
| Zimbabweans | 97.7 /100 | #95 | Exceptional $110,011 |
| Immigrants | Moldova | 97.7 /100 | #96 | Exceptional $109,975 |
| Jordanians | 97.5 /100 | #97 | Exceptional $109,865 |
| Immigrants | Kuwait | 97.4 /100 | #98 | Exceptional $109,731 |
| Armenians | 97.3 /100 | #99 | Exceptional $109,692 |
| Macedonians | 97.3 /100 | #100 | Exceptional $109,668 |
| Immigrants | Ukraine | 97.2 /100 | #101 | Exceptional $109,645 |
| Assyrians/Chaldeans/Syriacs | 97.2 /100 | #102 | Exceptional $109,622 |
| Immigrants | Brazil | 96.9 /100 | #103 | Exceptional $109,418 |
| Palestinians | 96.9 /100 | #104 | Exceptional $109,413 |
Demographics Similar to Yup'ik by Median Family Income
In terms of median family income, the demographic groups most similar to Yup'ik are Menominee ($79,563, a difference of 0.34%), Immigrants from Cuba ($78,249, a difference of 1.3%), Yuman ($78,055, a difference of 1.6%), Kiowa ($80,885, a difference of 2.0%), and Native/Alaskan ($80,908, a difference of 2.0%).
| Demographics | Rating | Rank | Median Family Income |
| Blacks/African Americans | 0.0 /100 | #328 | Tragic $81,912 |
| Dutch West Indians | 0.0 /100 | #329 | Tragic $81,852 |
| Cheyenne | 0.0 /100 | #330 | Tragic $81,385 |
| Immigrants | Dominican Republic | 0.0 /100 | #331 | Tragic $81,233 |
| Natives/Alaskans | 0.0 /100 | #332 | Tragic $80,908 |
| Kiowa | 0.0 /100 | #333 | Tragic $80,885 |
| Menominee | 0.0 /100 | #334 | Tragic $79,563 |
| Yup'ik | 0.0 /100 | #335 | Tragic $79,290 |
| Immigrants | Cuba | 0.0 /100 | #336 | Tragic $78,249 |
| Yuman | 0.0 /100 | #337 | Tragic $78,055 |
| Immigrants | Yemen | 0.0 /100 | #338 | Tragic $77,457 |
| Pima | 0.0 /100 | #339 | Tragic $77,431 |
| Hopi | 0.0 /100 | #340 | Tragic $77,188 |
| Pueblo | 0.0 /100 | #341 | Tragic $76,880 |
| Crow | 0.0 /100 | #342 | Tragic $76,605 |