Pima vs Yup'ik Currently Married
COMPARE
Pima
Yup'ik
Currently Married
Currently Married Comparison
Pima
Yup'ik
35.9%
CURRENTLY MARRIED
0.0/ 100
METRIC RATING
347th/ 347
METRIC RANK
39.9%
CURRENTLY MARRIED
0.0/ 100
METRIC RATING
333rd/ 347
METRIC RANK
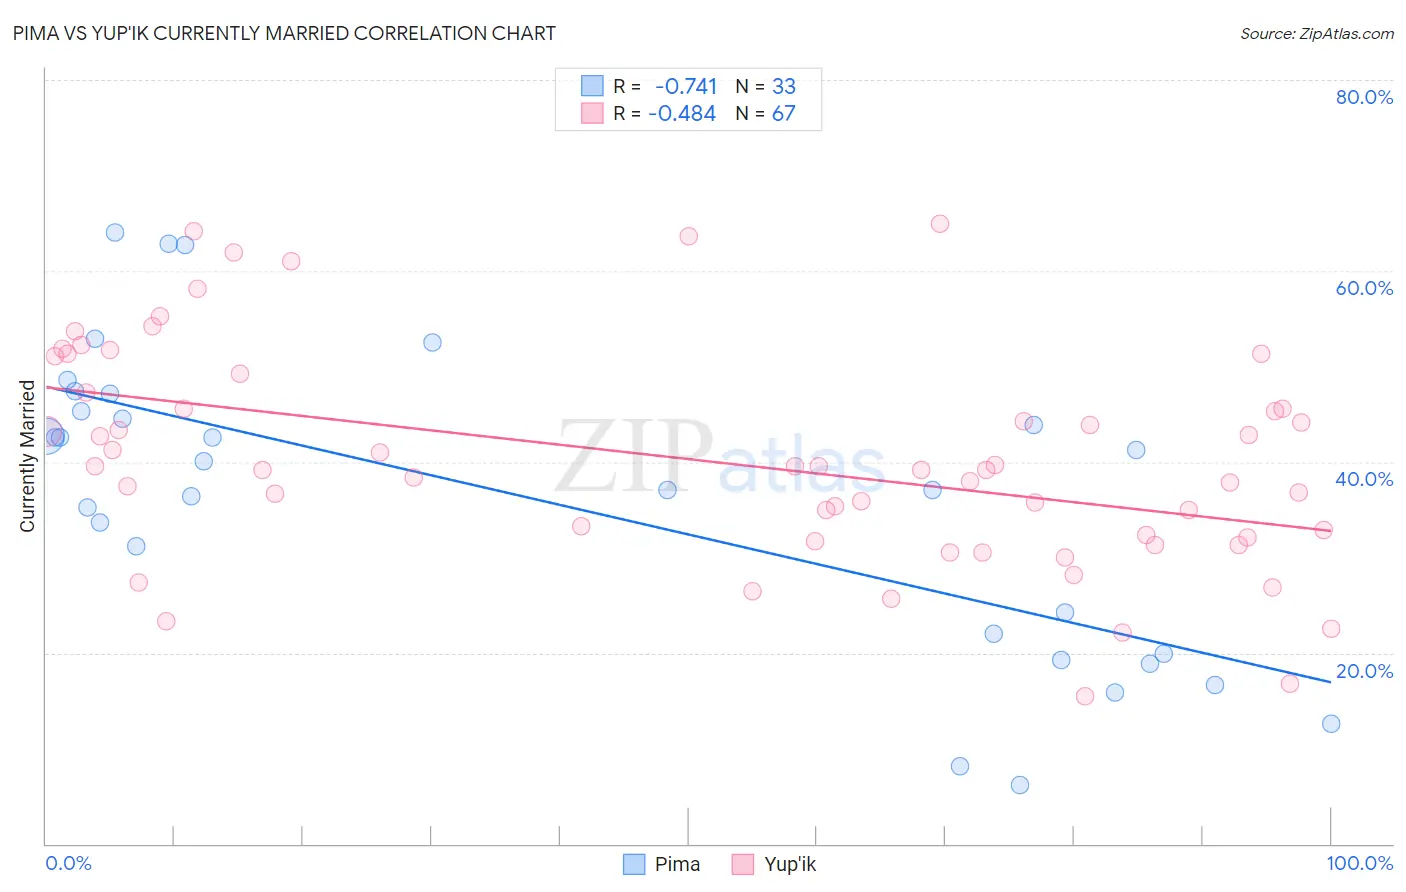
Pima vs Yup'ik Currently Married Correlation Chart
The statistical analysis conducted on geographies consisting of 61,552,342 people shows a strong negative correlation between the proportion of Pima and percentage of population currently married in the United States with a correlation coefficient (R) of -0.741 and weighted average of 35.9%. Similarly, the statistical analysis conducted on geographies consisting of 39,963,234 people shows a moderate negative correlation between the proportion of Yup'ik and percentage of population currently married in the United States with a correlation coefficient (R) of -0.484 and weighted average of 39.9%, a difference of 11.1%.
Currently Married Correlation Summary
| Measurement | Pima | Yup'ik |
| Minimum | 6.2% | 15.4% |
| Maximum | 64.0% | 65.0% |
| Range | 57.8% | 49.6% |
| Mean | 36.3% | 40.2% |
| Median | 40.1% | 39.2% |
| Interquartile 25% (IQ1) | 21.0% | 32.1% |
| Interquartile 75% (IQ3) | 46.2% | 47.3% |
| Interquartile Range (IQR) | 25.2% | 15.2% |
| Standard Deviation (Sample) | 15.6% | 11.4% |
| Standard Deviation (Population) | 15.4% | 11.3% |
Demographics Similar to Pima and Yup'ik by Currently Married
In terms of currently married, the demographic groups most similar to Pima are Hopi (36.5%, a difference of 1.8%), Tohono O'odham (36.8%, a difference of 2.4%), Immigrants from Cabo Verde (37.8%, a difference of 5.4%), Pueblo (38.2%, a difference of 6.5%), and Immigrants from Dominican Republic (38.9%, a difference of 8.4%). Similarly, the demographic groups most similar to Yup'ik are Puerto Rican (39.9%, a difference of 0.010%), Lumbee (39.8%, a difference of 0.18%), British West Indian (39.8%, a difference of 0.35%), Immigrants from St. Vincent and the Grenadines (40.1%, a difference of 0.39%), and Black/African American (39.6%, a difference of 0.73%).
| Demographics | Rating | Rank | Currently Married |
| Arapaho | 0.0 /100 | #328 | Tragic 40.5% |
| Crow | 0.0 /100 | #329 | Tragic 40.4% |
| Immigrants | Dominica | 0.0 /100 | #330 | Tragic 40.3% |
| Immigrants | Barbados | 0.0 /100 | #331 | Tragic 40.3% |
| Immigrants | St. Vincent and the Grenadines | 0.0 /100 | #332 | Tragic 40.1% |
| Yup'ik | 0.0 /100 | #333 | Tragic 39.9% |
| Puerto Ricans | 0.0 /100 | #334 | Tragic 39.9% |
| Lumbee | 0.0 /100 | #335 | Tragic 39.8% |
| British West Indians | 0.0 /100 | #336 | Tragic 39.8% |
| Blacks/African Americans | 0.0 /100 | #337 | Tragic 39.6% |
| Cape Verdeans | 0.0 /100 | #338 | Tragic 39.6% |
| Dominicans | 0.0 /100 | #339 | Tragic 39.5% |
| Immigrants | Grenada | 0.0 /100 | #340 | Tragic 39.1% |
| Navajo | 0.0 /100 | #341 | Tragic 39.0% |
| Immigrants | Dominican Republic | 0.0 /100 | #342 | Tragic 38.9% |
| Pueblo | 0.0 /100 | #343 | Tragic 38.2% |
| Immigrants | Cabo Verde | 0.0 /100 | #344 | Tragic 37.8% |
| Tohono O'odham | 0.0 /100 | #345 | Tragic 36.8% |
| Hopi | 0.0 /100 | #346 | Tragic 36.5% |
| Pima | 0.0 /100 | #347 | Tragic 35.9% |