Jordanian vs Japanese In Labor Force | Age 20-24
COMPARE
Jordanian
Japanese
In Labor Force | Age 20-24
In Labor Force | Age 20-24 Comparison
Jordanians
Japanese
75.5%
IN LABOR FORCE | AGE 20-24
84.8/ 100
METRIC RATING
137th/ 347
METRIC RANK
75.3%
IN LABOR FORCE | AGE 20-24
68.7/ 100
METRIC RATING
160th/ 347
METRIC RANK
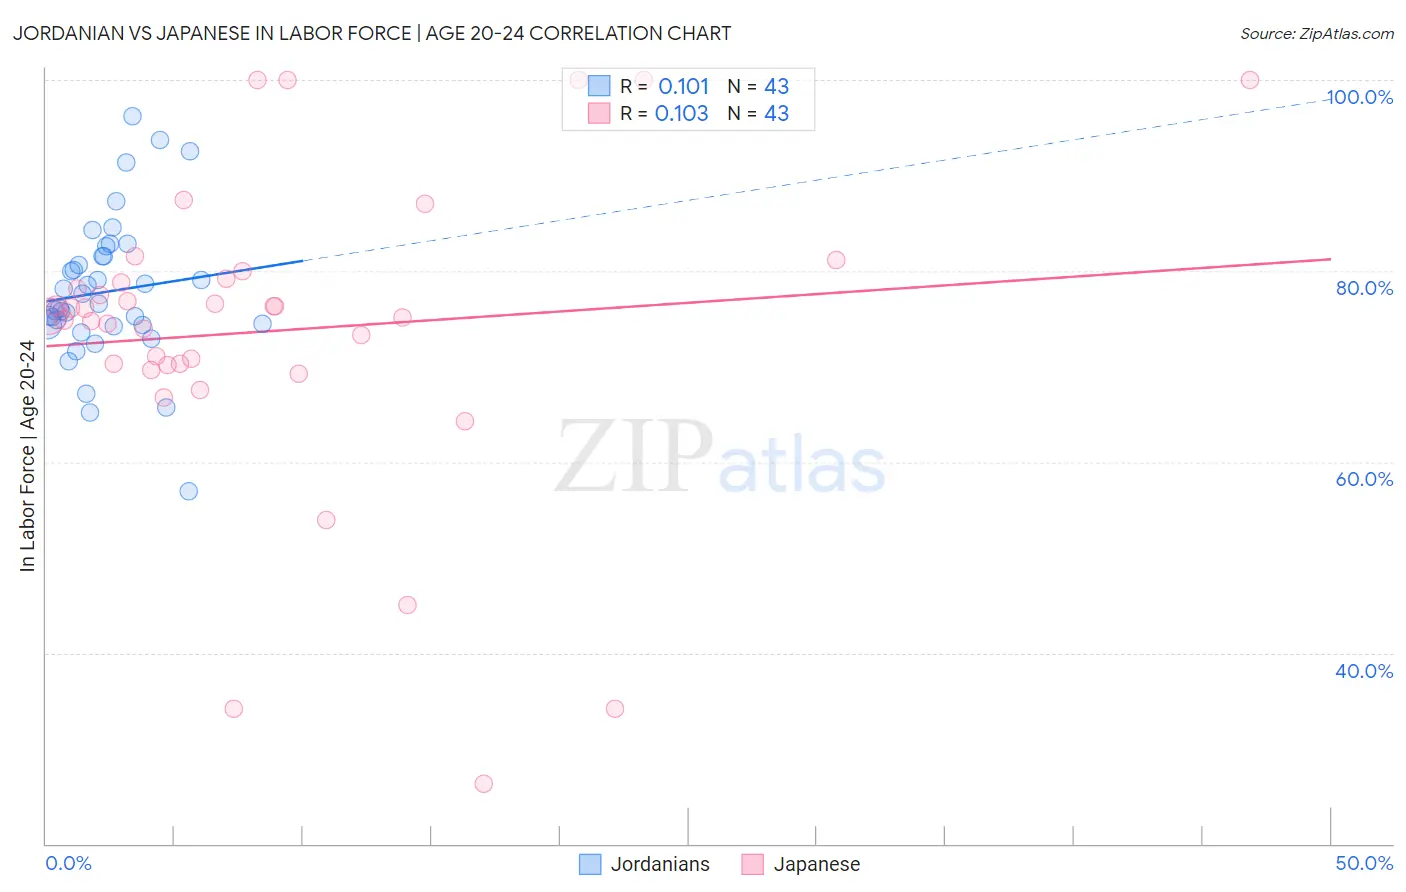
Jordanian vs Japanese In Labor Force | Age 20-24 Correlation Chart
The statistical analysis conducted on geographies consisting of 166,409,280 people shows a poor positive correlation between the proportion of Jordanians and labor force participation rate among population between the ages 20 and 24 in the United States with a correlation coefficient (R) of 0.101 and weighted average of 75.5%. Similarly, the statistical analysis conducted on geographies consisting of 249,162,424 people shows a poor positive correlation between the proportion of Japanese and labor force participation rate among population between the ages 20 and 24 in the United States with a correlation coefficient (R) of 0.103 and weighted average of 75.3%, a difference of 0.34%.
In Labor Force | Age 20-24 Correlation Summary
| Measurement | Jordanian | Japanese |
| Minimum | 56.9% | 26.3% |
| Maximum | 96.2% | 100.0% |
| Range | 39.3% | 73.7% |
| Mean | 77.8% | 73.7% |
| Median | 76.6% | 75.3% |
| Interquartile 25% (IQ1) | 74.3% | 70.1% |
| Interquartile 75% (IQ3) | 81.6% | 79.2% |
| Interquartile Range (IQR) | 7.3% | 9.1% |
| Standard Deviation (Sample) | 7.6% | 16.2% |
| Standard Deviation (Population) | 7.5% | 16.0% |
Similar Demographics by In Labor Force | Age 20-24
Demographics Similar to Jordanians by In Labor Force | Age 20-24
In terms of in labor force | age 20-24, the demographic groups most similar to Jordanians are Immigrants from Brazil (75.5%, a difference of 0.0%), Australian (75.5%, a difference of 0.0%), Immigrants from England (75.5%, a difference of 0.010%), Delaware (75.5%, a difference of 0.010%), and Yaqui (75.5%, a difference of 0.020%).
| Demographics | Rating | Rank | In Labor Force | Age 20-24 |
| Immigrants | Austria | 88.8 /100 | #130 | Excellent 75.6% |
| Immigrants | Jordan | 88.5 /100 | #131 | Excellent 75.6% |
| Palestinians | 88.4 /100 | #132 | Excellent 75.6% |
| Zimbabweans | 88.2 /100 | #133 | Excellent 75.6% |
| Estonians | 87.1 /100 | #134 | Excellent 75.6% |
| Yaqui | 85.5 /100 | #135 | Excellent 75.5% |
| Immigrants | Brazil | 84.8 /100 | #136 | Excellent 75.5% |
| Jordanians | 84.8 /100 | #137 | Excellent 75.5% |
| Australians | 84.8 /100 | #138 | Excellent 75.5% |
| Immigrants | England | 84.6 /100 | #139 | Excellent 75.5% |
| Delaware | 84.5 /100 | #140 | Excellent 75.5% |
| Romanians | 84.1 /100 | #141 | Excellent 75.5% |
| Blackfeet | 83.6 /100 | #142 | Excellent 75.5% |
| Spaniards | 82.0 /100 | #143 | Excellent 75.5% |
| Bhutanese | 80.8 /100 | #144 | Excellent 75.4% |
Demographics Similar to Japanese by In Labor Force | Age 20-24
In terms of in labor force | age 20-24, the demographic groups most similar to Japanese are South American Indian (75.3%, a difference of 0.010%), Immigrants from Bolivia (75.3%, a difference of 0.040%), Immigrants from El Salvador (75.3%, a difference of 0.050%), Immigrants from Western Europe (75.3%, a difference of 0.050%), and New Zealander (75.2%, a difference of 0.050%).
| Demographics | Rating | Rank | In Labor Force | Age 20-24 |
| Guatemalans | 72.3 /100 | #153 | Good 75.3% |
| Osage | 72.3 /100 | #154 | Good 75.3% |
| Immigrants | Guatemala | 71.9 /100 | #155 | Good 75.3% |
| Immigrants | El Salvador | 71.7 /100 | #156 | Good 75.3% |
| Immigrants | Western Europe | 71.5 /100 | #157 | Good 75.3% |
| Immigrants | Bolivia | 71.0 /100 | #158 | Good 75.3% |
| South American Indians | 69.0 /100 | #159 | Good 75.3% |
| Japanese | 68.7 /100 | #160 | Good 75.3% |
| New Zealanders | 65.4 /100 | #161 | Good 75.2% |
| Immigrants | Romania | 64.6 /100 | #162 | Good 75.2% |
| Costa Ricans | 64.2 /100 | #163 | Good 75.2% |
| Bolivians | 64.0 /100 | #164 | Good 75.2% |
| Afghans | 63.5 /100 | #165 | Good 75.2% |
| Cambodians | 60.5 /100 | #166 | Good 75.2% |
| Immigrants | South Eastern Asia | 57.5 /100 | #167 | Average 75.1% |