Colombian vs Japanese Currently Married
COMPARE
Colombian
Japanese
Currently Married
Currently Married Comparison
Colombians
Japanese
46.3%
CURRENTLY MARRIED
31.8/ 100
METRIC RATING
188th/ 347
METRIC RANK
44.5%
CURRENTLY MARRIED
0.6/ 100
METRIC RATING
244th/ 347
METRIC RANK
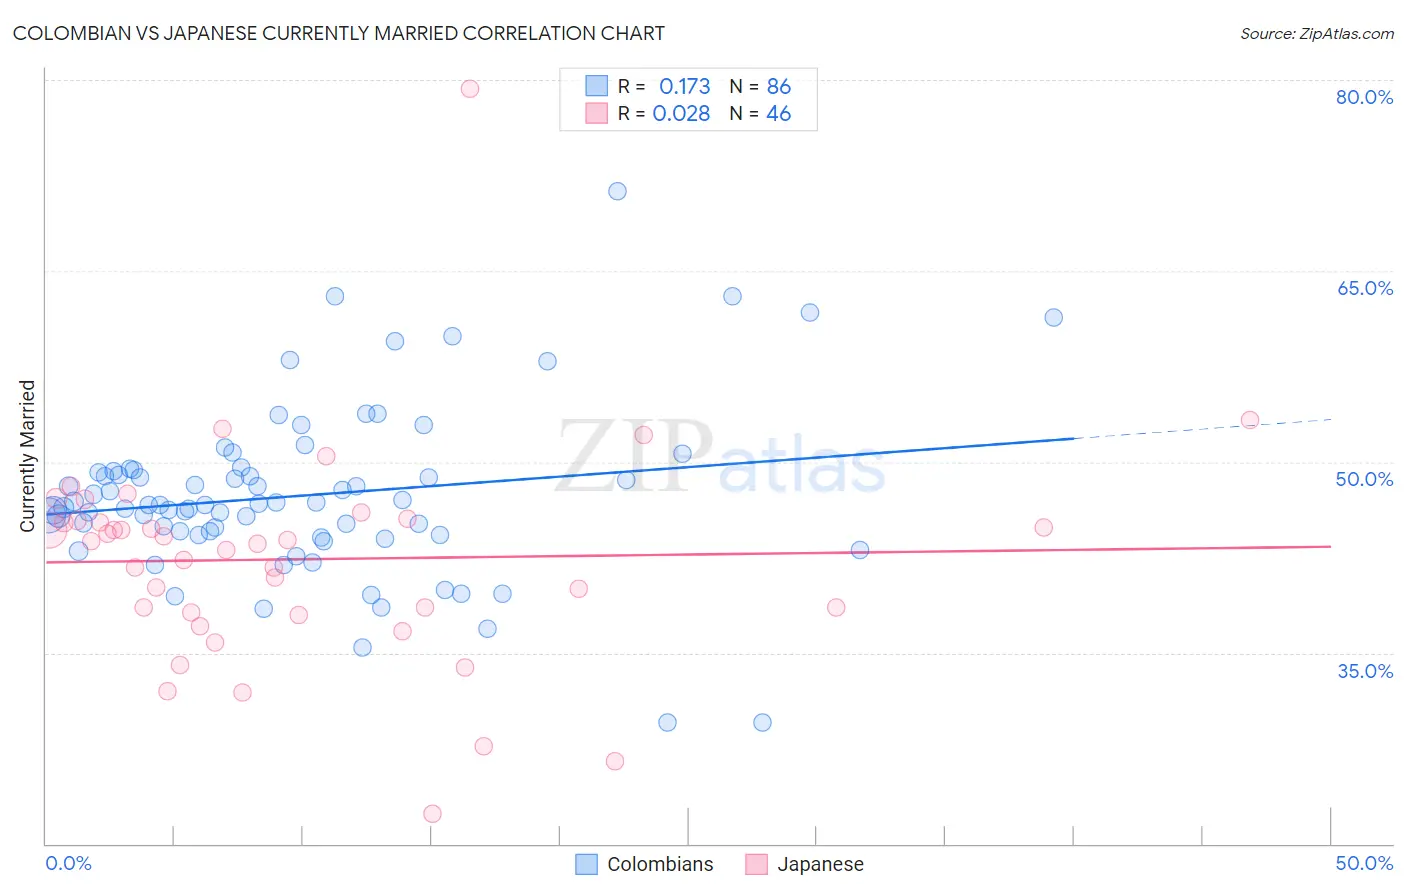
Colombian vs Japanese Currently Married Correlation Chart
The statistical analysis conducted on geographies consisting of 419,624,806 people shows a poor positive correlation between the proportion of Colombians and percentage of population currently married in the United States with a correlation coefficient (R) of 0.173 and weighted average of 46.3%. Similarly, the statistical analysis conducted on geographies consisting of 249,168,550 people shows no correlation between the proportion of Japanese and percentage of population currently married in the United States with a correlation coefficient (R) of 0.028 and weighted average of 44.5%, a difference of 4.1%.
Currently Married Correlation Summary
| Measurement | Colombian | Japanese |
| Minimum | 29.5% | 22.4% |
| Maximum | 71.3% | 79.3% |
| Range | 41.8% | 56.9% |
| Mean | 47.4% | 42.3% |
| Median | 46.6% | 43.7% |
| Interquartile 25% (IQ1) | 44.3% | 38.2% |
| Interquartile 75% (IQ3) | 49.3% | 45.4% |
| Interquartile Range (IQR) | 5.0% | 7.2% |
| Standard Deviation (Sample) | 6.8% | 8.6% |
| Standard Deviation (Population) | 6.7% | 8.6% |
Similar Demographics by Currently Married
Demographics Similar to Colombians by Currently Married
In terms of currently married, the demographic groups most similar to Colombians are Fijian (46.3%, a difference of 0.060%), Choctaw (46.3%, a difference of 0.12%), Immigrants from Peru (46.4%, a difference of 0.14%), Immigrants from France (46.2%, a difference of 0.18%), and Immigrants from Chile (46.4%, a difference of 0.20%).
| Demographics | Rating | Rank | Currently Married |
| Ottawa | 43.0 /100 | #181 | Average 46.5% |
| Potawatomi | 41.9 /100 | #182 | Average 46.5% |
| Immigrants | Northern Africa | 39.7 /100 | #183 | Fair 46.5% |
| Brazilians | 39.3 /100 | #184 | Fair 46.4% |
| Mongolians | 37.6 /100 | #185 | Fair 46.4% |
| Immigrants | Chile | 36.8 /100 | #186 | Fair 46.4% |
| Immigrants | Peru | 35.3 /100 | #187 | Fair 46.4% |
| Colombians | 31.8 /100 | #188 | Fair 46.3% |
| Fijians | 30.3 /100 | #189 | Fair 46.3% |
| Choctaw | 29.1 /100 | #190 | Fair 46.3% |
| Immigrants | France | 27.7 /100 | #191 | Fair 46.2% |
| Soviet Union | 25.7 /100 | #192 | Fair 46.2% |
| Immigrants | Fiji | 25.0 /100 | #193 | Fair 46.2% |
| South Americans | 23.8 /100 | #194 | Fair 46.1% |
| Immigrants | Nepal | 23.7 /100 | #195 | Fair 46.1% |
Demographics Similar to Japanese by Currently Married
In terms of currently married, the demographic groups most similar to Japanese are Immigrants from Ethiopia (44.5%, a difference of 0.070%), Immigrants from Cambodia (44.5%, a difference of 0.090%), Ethiopian (44.5%, a difference of 0.12%), Immigrants from Mexico (44.5%, a difference of 0.18%), and Mexican American Indian (44.5%, a difference of 0.18%).
| Demographics | Rating | Rank | Currently Married |
| Seminole | 0.9 /100 | #237 | Tragic 44.6% |
| Moroccans | 0.9 /100 | #238 | Tragic 44.6% |
| Immigrants | Mexico | 0.7 /100 | #239 | Tragic 44.5% |
| Mexican American Indians | 0.7 /100 | #240 | Tragic 44.5% |
| Ethiopians | 0.7 /100 | #241 | Tragic 44.5% |
| Immigrants | Cambodia | 0.7 /100 | #242 | Tragic 44.5% |
| Immigrants | Ethiopia | 0.7 /100 | #243 | Tragic 44.5% |
| Japanese | 0.6 /100 | #244 | Tragic 44.5% |
| Immigrants | Armenia | 0.4 /100 | #245 | Tragic 44.3% |
| Immigrants | Burma/Myanmar | 0.4 /100 | #246 | Tragic 44.3% |
| Ugandans | 0.4 /100 | #247 | Tragic 44.2% |
| Nicaraguans | 0.3 /100 | #248 | Tragic 44.2% |
| Immigrants | Cameroon | 0.3 /100 | #249 | Tragic 44.2% |
| Immigrants | Eastern Africa | 0.3 /100 | #250 | Tragic 44.2% |
| Blackfeet | 0.3 /100 | #251 | Tragic 44.2% |