Nicaraguan vs Immigrants from Sudan Currently Married
COMPARE
Nicaraguan
Immigrants from Sudan
Currently Married
Currently Married Comparison
Nicaraguans
Immigrants from Sudan
44.2%
CURRENTLY MARRIED
0.3/ 100
METRIC RATING
248th/ 347
METRIC RANK
43.5%
CURRENTLY MARRIED
0.1/ 100
METRIC RATING
269th/ 347
METRIC RANK
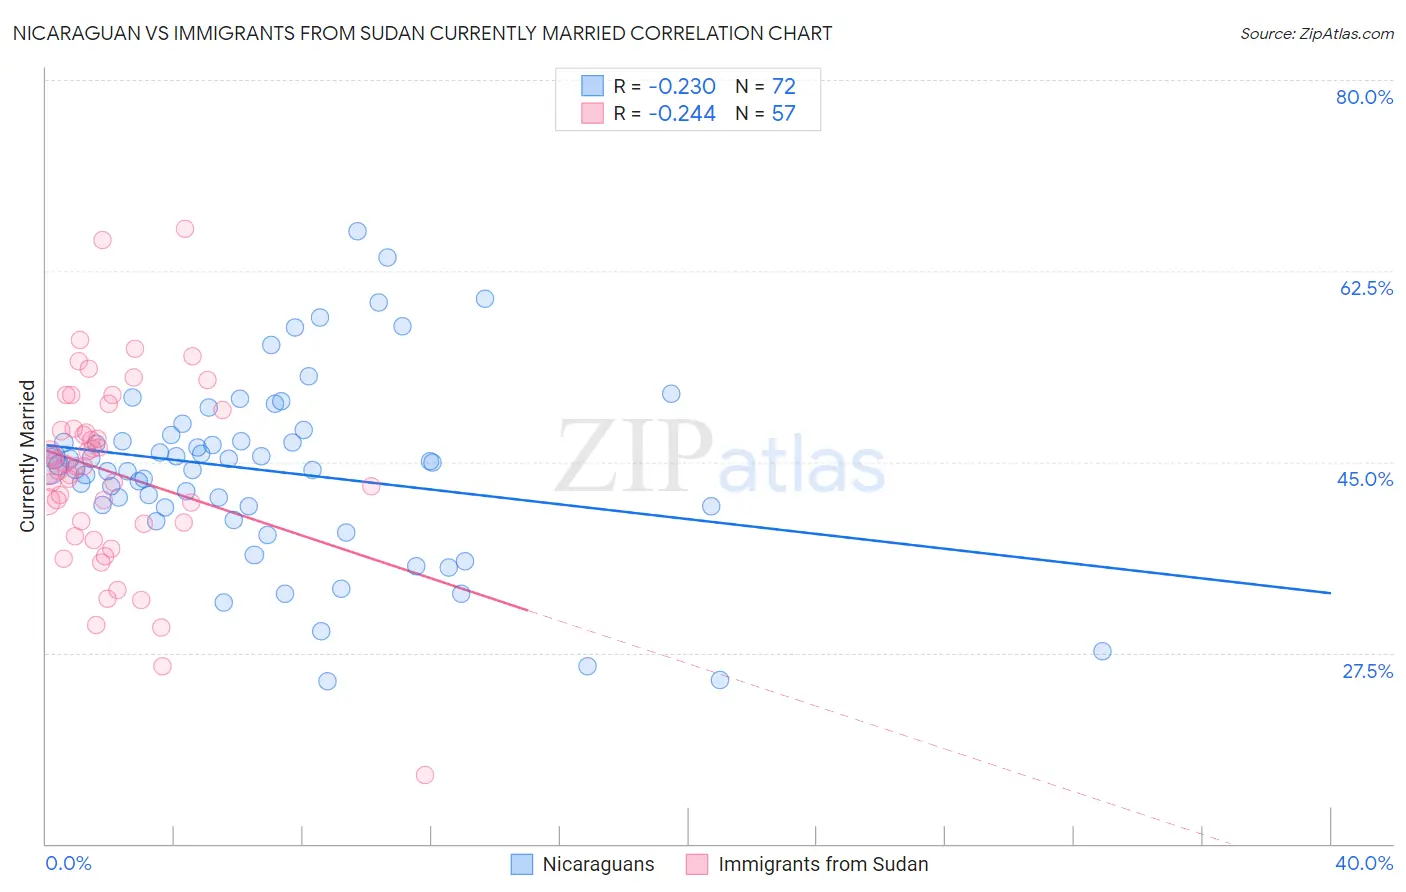
Nicaraguan vs Immigrants from Sudan Currently Married Correlation Chart
The statistical analysis conducted on geographies consisting of 285,678,728 people shows a weak negative correlation between the proportion of Nicaraguans and percentage of population currently married in the United States with a correlation coefficient (R) of -0.230 and weighted average of 44.2%. Similarly, the statistical analysis conducted on geographies consisting of 118,963,461 people shows a weak negative correlation between the proportion of Immigrants from Sudan and percentage of population currently married in the United States with a correlation coefficient (R) of -0.244 and weighted average of 43.5%, a difference of 1.6%.
Currently Married Correlation Summary
| Measurement | Nicaraguan | Immigrants from Sudan |
| Minimum | 24.9% | 16.3% |
| Maximum | 66.1% | 66.4% |
| Range | 41.2% | 50.1% |
| Mean | 44.2% | 44.1% |
| Median | 44.6% | 44.6% |
| Interquartile 25% (IQ1) | 40.9% | 39.4% |
| Interquartile 75% (IQ3) | 47.2% | 48.9% |
| Interquartile Range (IQR) | 6.3% | 9.6% |
| Standard Deviation (Sample) | 8.4% | 8.8% |
| Standard Deviation (Population) | 8.3% | 8.7% |
Similar Demographics by Currently Married
Demographics Similar to Nicaraguans by Currently Married
In terms of currently married, the demographic groups most similar to Nicaraguans are Immigrants from Cameroon (44.2%, a difference of 0.020%), Immigrants from Eastern Africa (44.2%, a difference of 0.040%), Ugandan (44.2%, a difference of 0.090%), Blackfeet (44.2%, a difference of 0.10%), and Hispanic or Latino (44.1%, a difference of 0.12%).
| Demographics | Rating | Rank | Currently Married |
| Ethiopians | 0.7 /100 | #241 | Tragic 44.5% |
| Immigrants | Cambodia | 0.7 /100 | #242 | Tragic 44.5% |
| Immigrants | Ethiopia | 0.7 /100 | #243 | Tragic 44.5% |
| Japanese | 0.6 /100 | #244 | Tragic 44.5% |
| Immigrants | Armenia | 0.4 /100 | #245 | Tragic 44.3% |
| Immigrants | Burma/Myanmar | 0.4 /100 | #246 | Tragic 44.3% |
| Ugandans | 0.4 /100 | #247 | Tragic 44.2% |
| Nicaraguans | 0.3 /100 | #248 | Tragic 44.2% |
| Immigrants | Cameroon | 0.3 /100 | #249 | Tragic 44.2% |
| Immigrants | Eastern Africa | 0.3 /100 | #250 | Tragic 44.2% |
| Blackfeet | 0.3 /100 | #251 | Tragic 44.2% |
| Hispanics or Latinos | 0.3 /100 | #252 | Tragic 44.1% |
| Immigrants | Central America | 0.3 /100 | #253 | Tragic 44.1% |
| Vietnamese | 0.2 /100 | #254 | Tragic 44.0% |
| Yakama | 0.2 /100 | #255 | Tragic 44.0% |
Demographics Similar to Immigrants from Sudan by Currently Married
In terms of currently married, the demographic groups most similar to Immigrants from Sudan are Salvadoran (43.5%, a difference of 0.080%), Bermudan (43.5%, a difference of 0.090%), Spanish American Indian (43.6%, a difference of 0.12%), Immigrants from Eritrea (43.6%, a difference of 0.13%), and Indonesian (43.5%, a difference of 0.13%).
| Demographics | Rating | Rank | Currently Married |
| Bangladeshis | 0.1 /100 | #262 | Tragic 43.7% |
| Immigrants | Cuba | 0.1 /100 | #263 | Tragic 43.7% |
| Sudanese | 0.1 /100 | #264 | Tragic 43.7% |
| Immigrants | Bangladesh | 0.1 /100 | #265 | Tragic 43.6% |
| Ecuadorians | 0.1 /100 | #266 | Tragic 43.6% |
| Immigrants | Eritrea | 0.1 /100 | #267 | Tragic 43.6% |
| Spanish American Indians | 0.1 /100 | #268 | Tragic 43.6% |
| Immigrants | Sudan | 0.1 /100 | #269 | Tragic 43.5% |
| Salvadorans | 0.1 /100 | #270 | Tragic 43.5% |
| Bermudans | 0.1 /100 | #271 | Tragic 43.5% |
| Indonesians | 0.1 /100 | #272 | Tragic 43.5% |
| Yaqui | 0.1 /100 | #273 | Tragic 43.4% |
| Nigerians | 0.1 /100 | #274 | Tragic 43.4% |
| Colville | 0.1 /100 | #275 | Tragic 43.4% |
| Sierra Leoneans | 0.1 /100 | #276 | Tragic 43.4% |