Estonian vs Immigrants from Sudan Currently Married
COMPARE
Estonian
Immigrants from Sudan
Currently Married
Currently Married Comparison
Estonians
Immigrants from Sudan
48.2%
CURRENTLY MARRIED
97.4/ 100
METRIC RATING
74th/ 347
METRIC RANK
43.5%
CURRENTLY MARRIED
0.1/ 100
METRIC RATING
269th/ 347
METRIC RANK
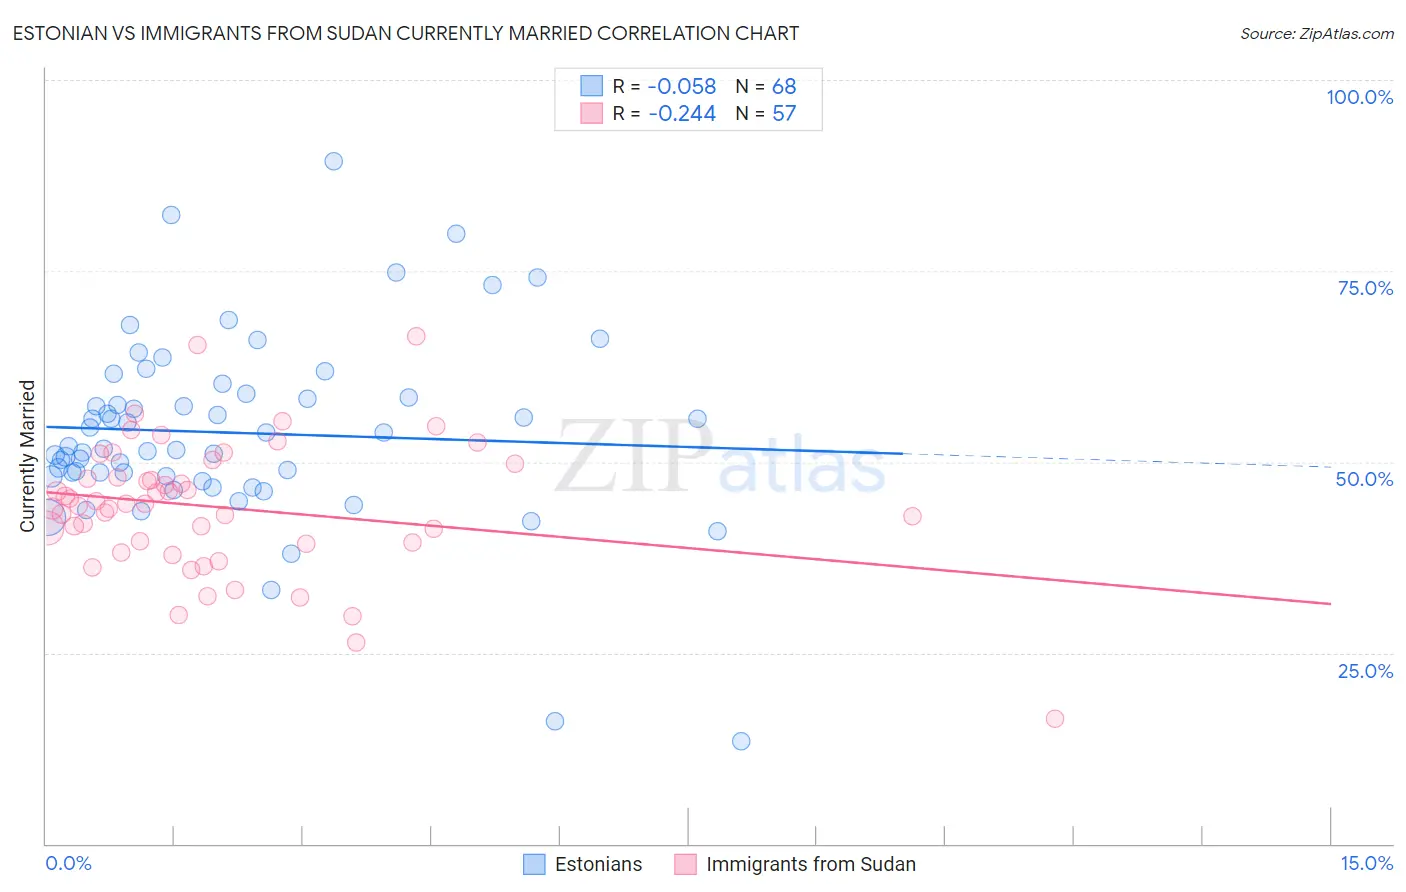
Estonian vs Immigrants from Sudan Currently Married Correlation Chart
The statistical analysis conducted on geographies consisting of 123,509,767 people shows a slight negative correlation between the proportion of Estonians and percentage of population currently married in the United States with a correlation coefficient (R) of -0.058 and weighted average of 48.2%. Similarly, the statistical analysis conducted on geographies consisting of 118,963,461 people shows a weak negative correlation between the proportion of Immigrants from Sudan and percentage of population currently married in the United States with a correlation coefficient (R) of -0.244 and weighted average of 43.5%, a difference of 10.7%.
Currently Married Correlation Summary
| Measurement | Estonian | Immigrants from Sudan |
| Minimum | 13.5% | 16.3% |
| Maximum | 89.3% | 66.4% |
| Range | 75.8% | 50.1% |
| Mean | 53.8% | 44.1% |
| Median | 51.9% | 44.6% |
| Interquartile 25% (IQ1) | 48.1% | 39.4% |
| Interquartile 75% (IQ3) | 58.7% | 48.9% |
| Interquartile Range (IQR) | 10.6% | 9.6% |
| Standard Deviation (Sample) | 12.4% | 8.8% |
| Standard Deviation (Population) | 12.3% | 8.7% |
Similar Demographics by Currently Married
Demographics Similar to Estonians by Currently Married
In terms of currently married, the demographic groups most similar to Estonians are Immigrants from Eastern Asia (48.2%, a difference of 0.030%), Immigrants from Lebanon (48.2%, a difference of 0.050%), Immigrants from Belarus (48.1%, a difference of 0.070%), Basque (48.1%, a difference of 0.090%), and Slovene (48.1%, a difference of 0.11%).
| Demographics | Rating | Rank | Currently Married |
| Slovaks | 98.2 /100 | #67 | Exceptional 48.3% |
| Immigrants | England | 98.2 /100 | #68 | Exceptional 48.3% |
| Canadians | 98.1 /100 | #69 | Exceptional 48.3% |
| Immigrants | Asia | 97.9 /100 | #70 | Exceptional 48.3% |
| Macedonians | 97.9 /100 | #71 | Exceptional 48.3% |
| Immigrants | Lebanon | 97.6 /100 | #72 | Exceptional 48.2% |
| Immigrants | Eastern Asia | 97.5 /100 | #73 | Exceptional 48.2% |
| Estonians | 97.4 /100 | #74 | Exceptional 48.2% |
| Immigrants | Belarus | 97.2 /100 | #75 | Exceptional 48.1% |
| Basques | 97.2 /100 | #76 | Exceptional 48.1% |
| Slovenes | 97.1 /100 | #77 | Exceptional 48.1% |
| Immigrants | Belgium | 97.1 /100 | #78 | Exceptional 48.1% |
| Immigrants | South Africa | 97.0 /100 | #79 | Exceptional 48.1% |
| Immigrants | Poland | 96.9 /100 | #80 | Exceptional 48.1% |
| Immigrants | Sri Lanka | 96.9 /100 | #81 | Exceptional 48.1% |
Demographics Similar to Immigrants from Sudan by Currently Married
In terms of currently married, the demographic groups most similar to Immigrants from Sudan are Salvadoran (43.5%, a difference of 0.080%), Bermudan (43.5%, a difference of 0.090%), Spanish American Indian (43.6%, a difference of 0.12%), Immigrants from Eritrea (43.6%, a difference of 0.13%), and Indonesian (43.5%, a difference of 0.13%).
| Demographics | Rating | Rank | Currently Married |
| Bangladeshis | 0.1 /100 | #262 | Tragic 43.7% |
| Immigrants | Cuba | 0.1 /100 | #263 | Tragic 43.7% |
| Sudanese | 0.1 /100 | #264 | Tragic 43.7% |
| Immigrants | Bangladesh | 0.1 /100 | #265 | Tragic 43.6% |
| Ecuadorians | 0.1 /100 | #266 | Tragic 43.6% |
| Immigrants | Eritrea | 0.1 /100 | #267 | Tragic 43.6% |
| Spanish American Indians | 0.1 /100 | #268 | Tragic 43.6% |
| Immigrants | Sudan | 0.1 /100 | #269 | Tragic 43.5% |
| Salvadorans | 0.1 /100 | #270 | Tragic 43.5% |
| Bermudans | 0.1 /100 | #271 | Tragic 43.5% |
| Indonesians | 0.1 /100 | #272 | Tragic 43.5% |
| Yaqui | 0.1 /100 | #273 | Tragic 43.4% |
| Nigerians | 0.1 /100 | #274 | Tragic 43.4% |
| Colville | 0.1 /100 | #275 | Tragic 43.4% |
| Sierra Leoneans | 0.1 /100 | #276 | Tragic 43.4% |