Irish vs Immigrants from Sudan Currently Married
COMPARE
Irish
Immigrants from Sudan
Currently Married
Currently Married Comparison
Irish
Immigrants from Sudan
48.9%
CURRENTLY MARRIED
99.5/ 100
METRIC RATING
33rd/ 347
METRIC RANK
43.5%
CURRENTLY MARRIED
0.1/ 100
METRIC RATING
269th/ 347
METRIC RANK
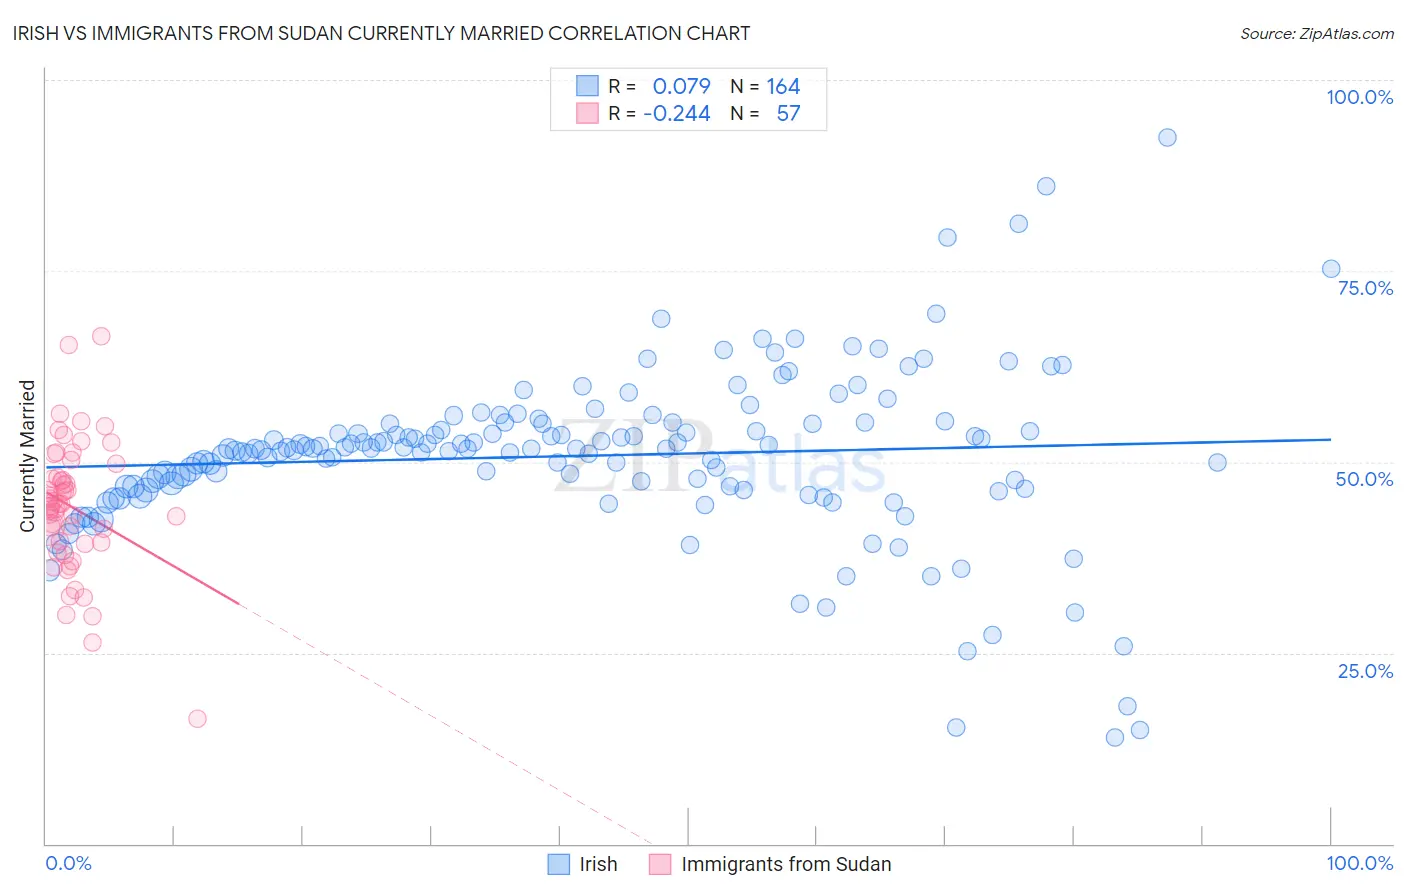
Irish vs Immigrants from Sudan Currently Married Correlation Chart
The statistical analysis conducted on geographies consisting of 580,554,006 people shows a slight positive correlation between the proportion of Irish and percentage of population currently married in the United States with a correlation coefficient (R) of 0.079 and weighted average of 48.9%. Similarly, the statistical analysis conducted on geographies consisting of 118,963,461 people shows a weak negative correlation between the proportion of Immigrants from Sudan and percentage of population currently married in the United States with a correlation coefficient (R) of -0.244 and weighted average of 43.5%, a difference of 12.3%.
Currently Married Correlation Summary
| Measurement | Irish | Immigrants from Sudan |
| Minimum | 13.9% | 16.3% |
| Maximum | 92.5% | 66.4% |
| Range | 78.6% | 50.1% |
| Mean | 50.8% | 44.1% |
| Median | 51.7% | 44.6% |
| Interquartile 25% (IQ1) | 46.6% | 39.4% |
| Interquartile 75% (IQ3) | 55.0% | 48.9% |
| Interquartile Range (IQR) | 8.4% | 9.6% |
| Standard Deviation (Sample) | 11.2% | 8.8% |
| Standard Deviation (Population) | 11.1% | 8.7% |
Similar Demographics by Currently Married
Demographics Similar to Irish by Currently Married
In terms of currently married, the demographic groups most similar to Irish are Immigrants from Hong Kong (48.9%, a difference of 0.040%), Eastern European (48.9%, a difference of 0.050%), Polish (48.9%, a difference of 0.050%), Croatian (48.9%, a difference of 0.060%), and Immigrants from Lithuania (48.8%, a difference of 0.060%).
| Demographics | Rating | Rank | Currently Married |
| Immigrants | Korea | 99.6 /100 | #26 | Exceptional 49.0% |
| Burmese | 99.6 /100 | #27 | Exceptional 48.9% |
| Welsh | 99.5 /100 | #28 | Exceptional 48.9% |
| Croatians | 99.5 /100 | #29 | Exceptional 48.9% |
| Eastern Europeans | 99.5 /100 | #30 | Exceptional 48.9% |
| Poles | 99.5 /100 | #31 | Exceptional 48.9% |
| Immigrants | Hong Kong | 99.5 /100 | #32 | Exceptional 48.9% |
| Irish | 99.5 /100 | #33 | Exceptional 48.9% |
| Immigrants | Lithuania | 99.4 /100 | #34 | Exceptional 48.8% |
| Immigrants | Northern Europe | 99.4 /100 | #35 | Exceptional 48.8% |
| Italians | 99.4 /100 | #36 | Exceptional 48.8% |
| Hungarians | 99.4 /100 | #37 | Exceptional 48.8% |
| Czechoslovakians | 99.4 /100 | #38 | Exceptional 48.8% |
| British | 99.4 /100 | #39 | Exceptional 48.8% |
| Immigrants | Canada | 99.4 /100 | #40 | Exceptional 48.8% |
Demographics Similar to Immigrants from Sudan by Currently Married
In terms of currently married, the demographic groups most similar to Immigrants from Sudan are Salvadoran (43.5%, a difference of 0.080%), Bermudan (43.5%, a difference of 0.090%), Spanish American Indian (43.6%, a difference of 0.12%), Immigrants from Eritrea (43.6%, a difference of 0.13%), and Indonesian (43.5%, a difference of 0.13%).
| Demographics | Rating | Rank | Currently Married |
| Bangladeshis | 0.1 /100 | #262 | Tragic 43.7% |
| Immigrants | Cuba | 0.1 /100 | #263 | Tragic 43.7% |
| Sudanese | 0.1 /100 | #264 | Tragic 43.7% |
| Immigrants | Bangladesh | 0.1 /100 | #265 | Tragic 43.6% |
| Ecuadorians | 0.1 /100 | #266 | Tragic 43.6% |
| Immigrants | Eritrea | 0.1 /100 | #267 | Tragic 43.6% |
| Spanish American Indians | 0.1 /100 | #268 | Tragic 43.6% |
| Immigrants | Sudan | 0.1 /100 | #269 | Tragic 43.5% |
| Salvadorans | 0.1 /100 | #270 | Tragic 43.5% |
| Bermudans | 0.1 /100 | #271 | Tragic 43.5% |
| Indonesians | 0.1 /100 | #272 | Tragic 43.5% |
| Yaqui | 0.1 /100 | #273 | Tragic 43.4% |
| Nigerians | 0.1 /100 | #274 | Tragic 43.4% |
| Colville | 0.1 /100 | #275 | Tragic 43.4% |
| Sierra Leoneans | 0.1 /100 | #276 | Tragic 43.4% |