Japanese vs Lithuanian Divorced or Separated
COMPARE
Japanese
Lithuanian
Divorced or Separated
Divorced or Separated Comparison
Japanese
Lithuanians
12.0%
DIVORCED OR SEPARATED
70.9/ 100
METRIC RATING
155th/ 347
METRIC RANK
11.7%
DIVORCED OR SEPARATED
95.7/ 100
METRIC RATING
115th/ 347
METRIC RANK
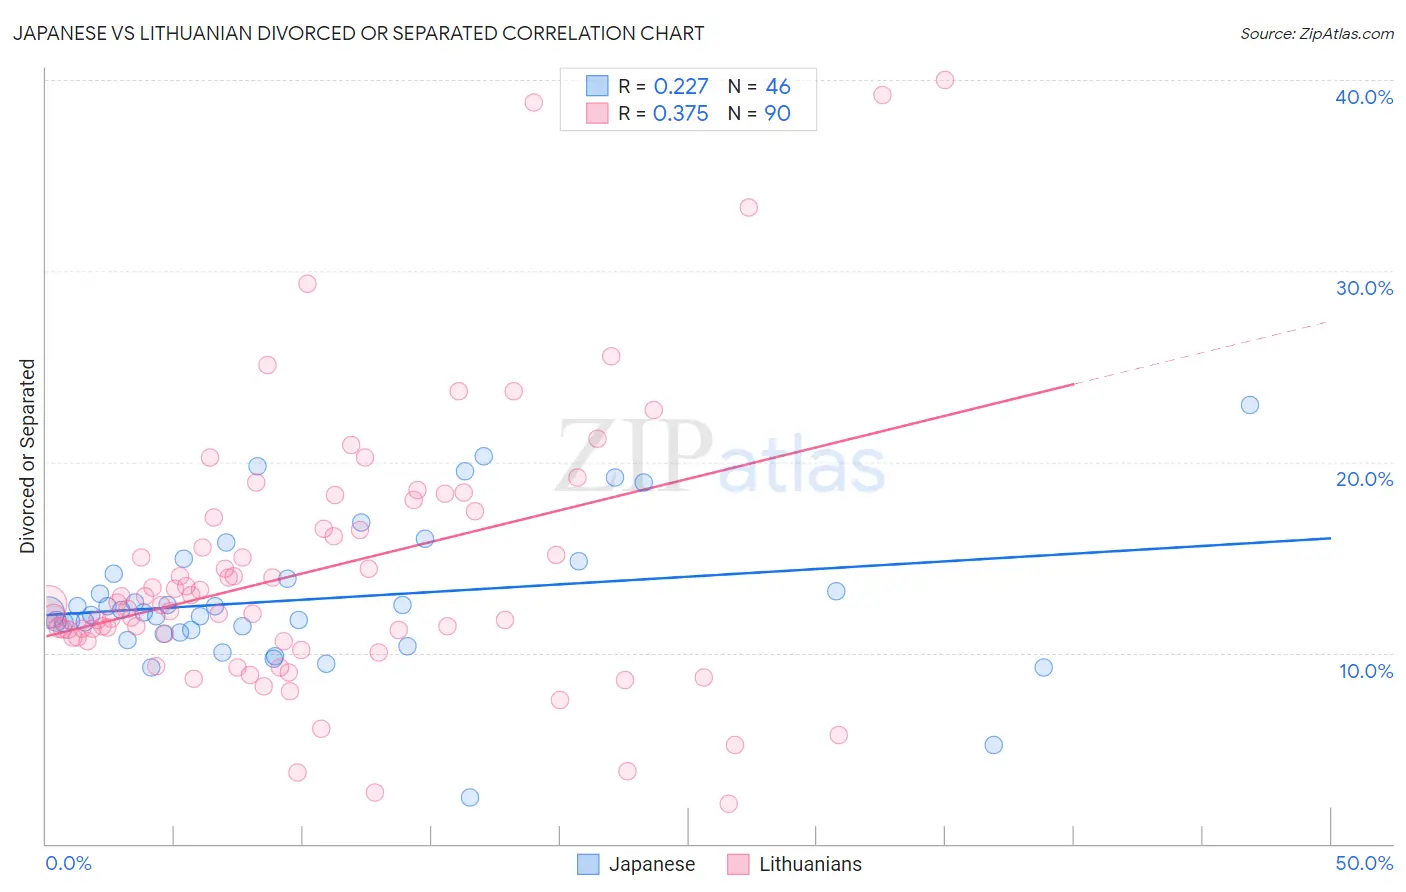
Japanese vs Lithuanian Divorced or Separated Correlation Chart
The statistical analysis conducted on geographies consisting of 249,125,963 people shows a weak positive correlation between the proportion of Japanese and percentage of population currently divorced or separated in the United States with a correlation coefficient (R) of 0.227 and weighted average of 12.0%. Similarly, the statistical analysis conducted on geographies consisting of 421,781,235 people shows a mild positive correlation between the proportion of Lithuanians and percentage of population currently divorced or separated in the United States with a correlation coefficient (R) of 0.375 and weighted average of 11.7%, a difference of 2.0%.
Divorced or Separated Correlation Summary
| Measurement | Japanese | Lithuanian |
| Minimum | 2.4% | 2.1% |
| Maximum | 23.0% | 40.0% |
| Range | 20.6% | 37.9% |
| Mean | 12.8% | 14.4% |
| Median | 12.1% | 12.5% |
| Interquartile 25% (IQ1) | 11.1% | 10.8% |
| Interquartile 75% (IQ3) | 14.1% | 17.1% |
| Interquartile Range (IQR) | 3.1% | 6.3% |
| Standard Deviation (Sample) | 3.8% | 7.2% |
| Standard Deviation (Population) | 3.7% | 7.2% |
Similar Demographics by Divorced or Separated
Demographics Similar to Japanese by Divorced or Separated
In terms of divorced or separated, the demographic groups most similar to Japanese are Chilean (12.0%, a difference of 0.020%), Hungarian (12.0%, a difference of 0.020%), Austrian (12.0%, a difference of 0.060%), Immigrants from Brazil (12.0%, a difference of 0.090%), and Immigrants from Hungary (11.9%, a difference of 0.12%).
| Demographics | Rating | Rank | Divorced or Separated |
| Italians | 77.8 /100 | #148 | Good 11.9% |
| Immigrants | Oceania | 77.7 /100 | #149 | Good 11.9% |
| Immigrants | Portugal | 77.3 /100 | #150 | Good 11.9% |
| Czechs | 76.4 /100 | #151 | Good 11.9% |
| Immigrants | Hungary | 73.7 /100 | #152 | Good 11.9% |
| Austrians | 72.2 /100 | #153 | Good 12.0% |
| Chileans | 71.3 /100 | #154 | Good 12.0% |
| Japanese | 70.9 /100 | #155 | Good 12.0% |
| Hungarians | 70.3 /100 | #156 | Good 12.0% |
| Immigrants | Brazil | 68.8 /100 | #157 | Good 12.0% |
| Icelanders | 66.0 /100 | #158 | Good 12.0% |
| Immigrants | Barbados | 66.0 /100 | #159 | Good 12.0% |
| Immigrants | Scotland | 65.8 /100 | #160 | Good 12.0% |
| Marshallese | 64.6 /100 | #161 | Good 12.0% |
| Samoans | 64.3 /100 | #162 | Good 12.0% |
Demographics Similar to Lithuanians by Divorced or Separated
In terms of divorced or separated, the demographic groups most similar to Lithuanians are Immigrants from Norway (11.7%, a difference of 0.050%), Immigrants from Iraq (11.7%, a difference of 0.060%), Immigrants from Uganda (11.7%, a difference of 0.080%), Ecuadorian (11.7%, a difference of 0.090%), and Syrian (11.7%, a difference of 0.13%).
| Demographics | Rating | Rank | Divorced or Separated |
| Greeks | 96.9 /100 | #108 | Exceptional 11.7% |
| Immigrants | South Africa | 96.9 /100 | #109 | Exceptional 11.7% |
| Immigrants | Czechoslovakia | 96.9 /100 | #110 | Exceptional 11.7% |
| Immigrants | Spain | 96.8 /100 | #111 | Exceptional 11.7% |
| Immigrants | France | 96.6 /100 | #112 | Exceptional 11.7% |
| Estonians | 96.6 /100 | #113 | Exceptional 11.7% |
| Immigrants | Norway | 95.9 /100 | #114 | Exceptional 11.7% |
| Lithuanians | 95.7 /100 | #115 | Exceptional 11.7% |
| Immigrants | Iraq | 95.4 /100 | #116 | Exceptional 11.7% |
| Immigrants | Uganda | 95.3 /100 | #117 | Exceptional 11.7% |
| Ecuadorians | 95.3 /100 | #118 | Exceptional 11.7% |
| Syrians | 95.1 /100 | #119 | Exceptional 11.7% |
| Iraqis | 94.6 /100 | #120 | Exceptional 11.8% |
| Romanians | 94.5 /100 | #121 | Exceptional 11.8% |
| Menominee | 93.8 /100 | #122 | Exceptional 11.8% |