Japanese vs Venezuelan Divorced or Separated
COMPARE
Japanese
Venezuelan
Divorced or Separated
Divorced or Separated Comparison
Japanese
Venezuelans
12.0%
DIVORCED OR SEPARATED
70.9/ 100
METRIC RATING
155th/ 347
METRIC RANK
13.0%
DIVORCED OR SEPARATED
0.0/ 100
METRIC RATING
298th/ 347
METRIC RANK
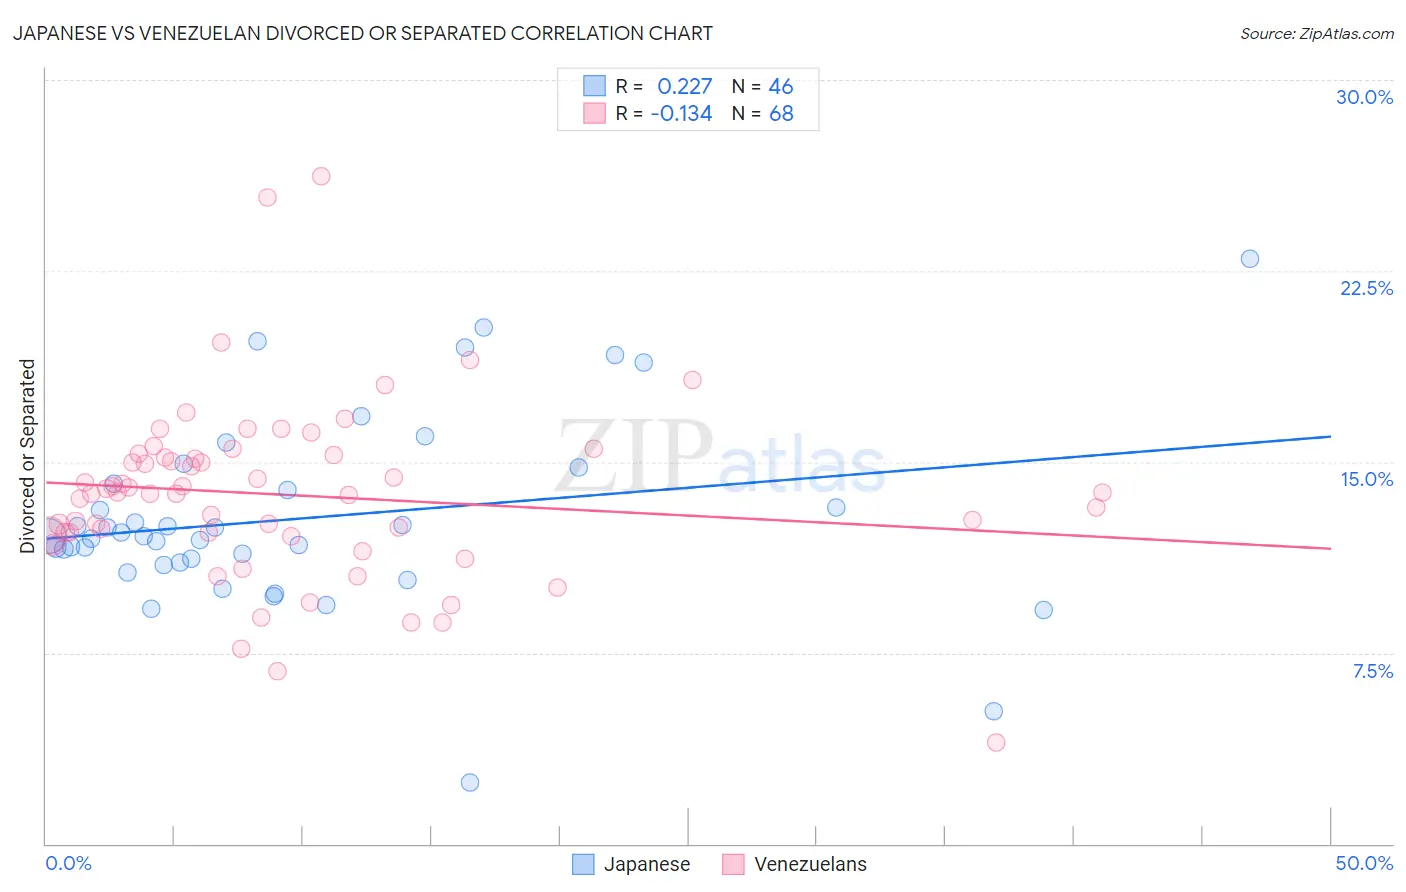
Japanese vs Venezuelan Divorced or Separated Correlation Chart
The statistical analysis conducted on geographies consisting of 249,125,963 people shows a weak positive correlation between the proportion of Japanese and percentage of population currently divorced or separated in the United States with a correlation coefficient (R) of 0.227 and weighted average of 12.0%. Similarly, the statistical analysis conducted on geographies consisting of 306,203,759 people shows a poor negative correlation between the proportion of Venezuelans and percentage of population currently divorced or separated in the United States with a correlation coefficient (R) of -0.134 and weighted average of 13.0%, a difference of 8.8%.
Divorced or Separated Correlation Summary
| Measurement | Japanese | Venezuelan |
| Minimum | 2.4% | 4.0% |
| Maximum | 23.0% | 26.2% |
| Range | 20.6% | 22.2% |
| Mean | 12.8% | 13.7% |
| Median | 12.1% | 13.8% |
| Interquartile 25% (IQ1) | 11.1% | 12.2% |
| Interquartile 75% (IQ3) | 14.1% | 15.2% |
| Interquartile Range (IQR) | 3.1% | 3.0% |
| Standard Deviation (Sample) | 3.8% | 3.5% |
| Standard Deviation (Population) | 3.7% | 3.5% |
Similar Demographics by Divorced or Separated
Demographics Similar to Japanese by Divorced or Separated
In terms of divorced or separated, the demographic groups most similar to Japanese are Chilean (12.0%, a difference of 0.020%), Hungarian (12.0%, a difference of 0.020%), Austrian (12.0%, a difference of 0.060%), Immigrants from Brazil (12.0%, a difference of 0.090%), and Immigrants from Hungary (11.9%, a difference of 0.12%).
| Demographics | Rating | Rank | Divorced or Separated |
| Italians | 77.8 /100 | #148 | Good 11.9% |
| Immigrants | Oceania | 77.7 /100 | #149 | Good 11.9% |
| Immigrants | Portugal | 77.3 /100 | #150 | Good 11.9% |
| Czechs | 76.4 /100 | #151 | Good 11.9% |
| Immigrants | Hungary | 73.7 /100 | #152 | Good 11.9% |
| Austrians | 72.2 /100 | #153 | Good 12.0% |
| Chileans | 71.3 /100 | #154 | Good 12.0% |
| Japanese | 70.9 /100 | #155 | Good 12.0% |
| Hungarians | 70.3 /100 | #156 | Good 12.0% |
| Immigrants | Brazil | 68.8 /100 | #157 | Good 12.0% |
| Icelanders | 66.0 /100 | #158 | Good 12.0% |
| Immigrants | Barbados | 66.0 /100 | #159 | Good 12.0% |
| Immigrants | Scotland | 65.8 /100 | #160 | Good 12.0% |
| Marshallese | 64.6 /100 | #161 | Good 12.0% |
| Samoans | 64.3 /100 | #162 | Good 12.0% |
Demographics Similar to Venezuelans by Divorced or Separated
In terms of divorced or separated, the demographic groups most similar to Venezuelans are Immigrants from Jamaica (13.0%, a difference of 0.040%), Native/Alaskan (13.0%, a difference of 0.070%), Nicaraguan (13.0%, a difference of 0.12%), Celtic (13.0%, a difference of 0.54%), and Immigrants from Cabo Verde (13.1%, a difference of 0.59%).
| Demographics | Rating | Rank | Divorced or Separated |
| Immigrants | Honduras | 0.0 /100 | #291 | Tragic 12.9% |
| Scotch-Irish | 0.0 /100 | #292 | Tragic 12.9% |
| Jamaicans | 0.0 /100 | #293 | Tragic 12.9% |
| Apache | 0.0 /100 | #294 | Tragic 12.9% |
| Celtics | 0.0 /100 | #295 | Tragic 13.0% |
| Nicaraguans | 0.0 /100 | #296 | Tragic 13.0% |
| Natives/Alaskans | 0.0 /100 | #297 | Tragic 13.0% |
| Venezuelans | 0.0 /100 | #298 | Tragic 13.0% |
| Immigrants | Jamaica | 0.0 /100 | #299 | Tragic 13.0% |
| Immigrants | Cabo Verde | 0.0 /100 | #300 | Tragic 13.1% |
| Alaskan Athabascans | 0.0 /100 | #301 | Tragic 13.1% |
| Immigrants | Venezuela | 0.0 /100 | #302 | Tragic 13.1% |
| Cape Verdeans | 0.0 /100 | #303 | Tragic 13.1% |
| Hopi | 0.0 /100 | #304 | Tragic 13.2% |
| Chippewa | 0.0 /100 | #305 | Tragic 13.2% |