Japanese vs Zimbabwean Single Father Households
COMPARE
Japanese
Zimbabwean
Single Father Households
Single Father Households Comparison
Japanese
Zimbabweans
2.8%
SINGLE FATHER HOUSEHOLDS
0.0/ 100
METRIC RATING
296th/ 347
METRIC RANK
2.2%
SINGLE FATHER HOUSEHOLDS
95.1/ 100
METRIC RATING
134th/ 347
METRIC RANK
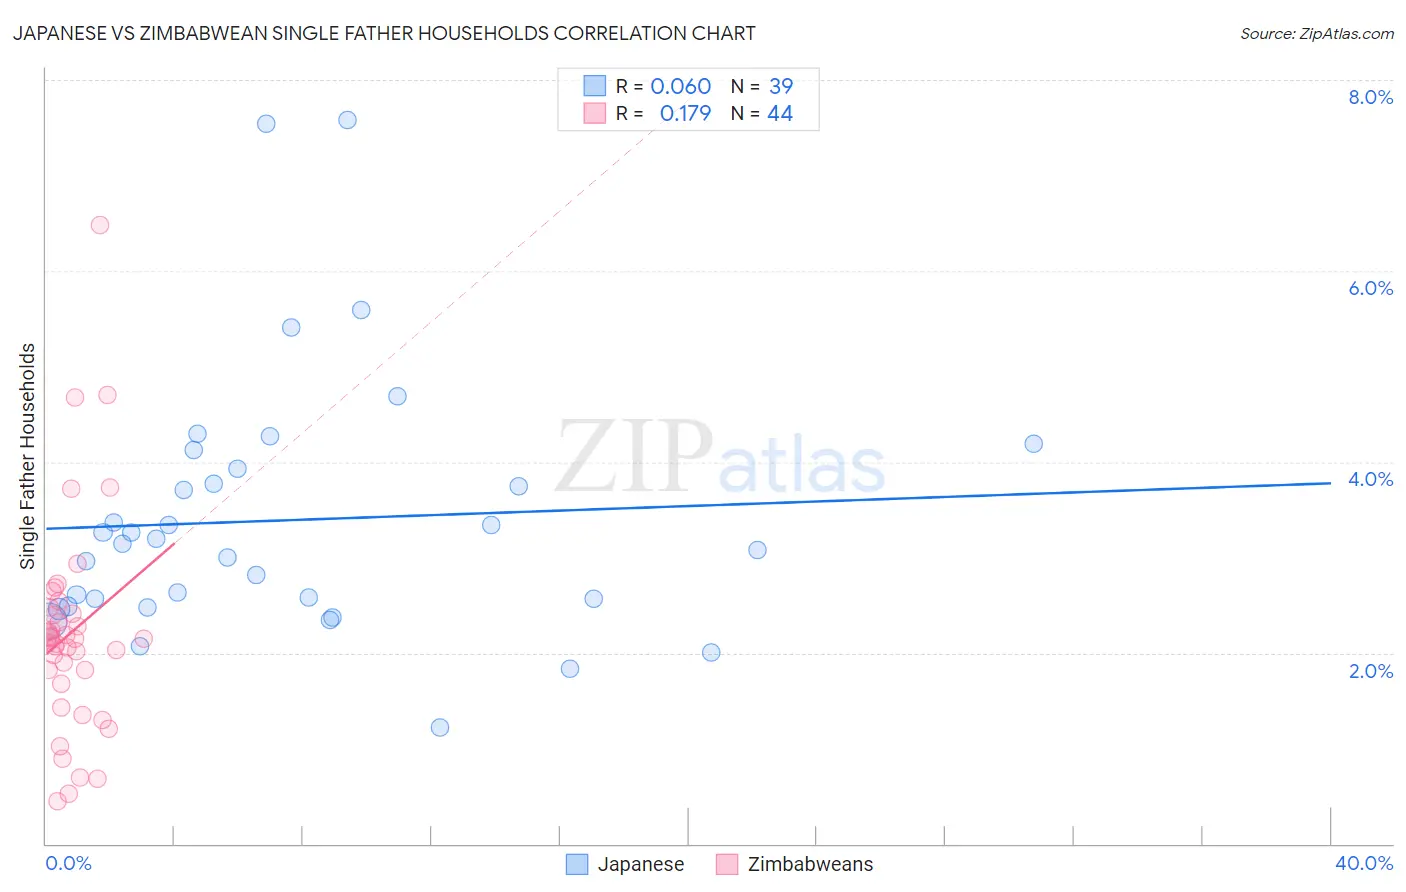
Japanese vs Zimbabwean Single Father Households Correlation Chart
The statistical analysis conducted on geographies consisting of 248,286,499 people shows a slight positive correlation between the proportion of Japanese and percentage of single father households in the United States with a correlation coefficient (R) of 0.060 and weighted average of 2.8%. Similarly, the statistical analysis conducted on geographies consisting of 69,107,979 people shows a poor positive correlation between the proportion of Zimbabweans and percentage of single father households in the United States with a correlation coefficient (R) of 0.179 and weighted average of 2.2%, a difference of 24.5%.
Single Father Households Correlation Summary
| Measurement | Japanese | Zimbabwean |
| Minimum | 1.2% | 0.45% |
| Maximum | 7.6% | 6.5% |
| Range | 6.4% | 6.0% |
| Mean | 3.4% | 2.2% |
| Median | 3.1% | 2.1% |
| Interquartile 25% (IQ1) | 2.5% | 1.7% |
| Interquartile 75% (IQ3) | 3.9% | 2.4% |
| Interquartile Range (IQR) | 1.4% | 0.70% |
| Standard Deviation (Sample) | 1.4% | 1.1% |
| Standard Deviation (Population) | 1.3% | 1.1% |
Similar Demographics by Single Father Households
Demographics Similar to Japanese by Single Father Households
In terms of single father households, the demographic groups most similar to Japanese are Chickasaw (2.8%, a difference of 0.020%), Honduran (2.8%, a difference of 0.080%), Cree (2.8%, a difference of 0.57%), Malaysian (2.7%, a difference of 0.83%), and Lumbee (2.8%, a difference of 0.95%).
| Demographics | Rating | Rank | Single Father Households |
| Tlingit-Haida | 0.0 /100 | #289 | Tragic 2.7% |
| Puget Sound Salish | 0.0 /100 | #290 | Tragic 2.7% |
| Blackfeet | 0.0 /100 | #291 | Tragic 2.7% |
| Choctaw | 0.0 /100 | #292 | Tragic 2.7% |
| Immigrants | Fiji | 0.0 /100 | #293 | Tragic 2.7% |
| Malaysians | 0.0 /100 | #294 | Tragic 2.7% |
| Chickasaw | 0.0 /100 | #295 | Tragic 2.8% |
| Japanese | 0.0 /100 | #296 | Tragic 2.8% |
| Hondurans | 0.0 /100 | #297 | Tragic 2.8% |
| Cree | 0.0 /100 | #298 | Tragic 2.8% |
| Lumbee | 0.0 /100 | #299 | Tragic 2.8% |
| Kiowa | 0.0 /100 | #300 | Tragic 2.8% |
| Immigrants | Latin America | 0.0 /100 | #301 | Tragic 2.8% |
| Spanish Americans | 0.0 /100 | #302 | Tragic 2.8% |
| Immigrants | Honduras | 0.0 /100 | #303 | Tragic 2.8% |
Demographics Similar to Zimbabweans by Single Father Households
In terms of single father households, the demographic groups most similar to Zimbabweans are Syrian (2.2%, a difference of 0.11%), Chilean (2.2%, a difference of 0.23%), Austrian (2.2%, a difference of 0.34%), West Indian (2.2%, a difference of 0.37%), and Taiwanese (2.2%, a difference of 0.60%).
| Demographics | Rating | Rank | Single Father Households |
| Jordanians | 96.9 /100 | #127 | Exceptional 2.2% |
| Immigrants | England | 96.8 /100 | #128 | Exceptional 2.2% |
| Serbians | 96.8 /100 | #129 | Exceptional 2.2% |
| Immigrants | Chile | 96.7 /100 | #130 | Exceptional 2.2% |
| Immigrants | Jordan | 96.6 /100 | #131 | Exceptional 2.2% |
| Poles | 96.5 /100 | #132 | Exceptional 2.2% |
| Taiwanese | 96.3 /100 | #133 | Exceptional 2.2% |
| Zimbabweans | 95.1 /100 | #134 | Exceptional 2.2% |
| Syrians | 94.8 /100 | #135 | Exceptional 2.2% |
| Chileans | 94.5 /100 | #136 | Exceptional 2.2% |
| Austrians | 94.2 /100 | #137 | Exceptional 2.2% |
| West Indians | 94.1 /100 | #138 | Exceptional 2.2% |
| Brazilians | 92.8 /100 | #139 | Exceptional 2.2% |
| British | 92.8 /100 | #140 | Exceptional 2.2% |
| Laotians | 92.5 /100 | #141 | Exceptional 2.2% |