Japanese vs Black/African American Divorced or Separated
COMPARE
Japanese
Black/African American
Divorced or Separated
Divorced or Separated Comparison
Japanese
Blacks/African Americans
12.0%
DIVORCED OR SEPARATED
70.9/ 100
METRIC RATING
155th/ 347
METRIC RANK
13.6%
DIVORCED OR SEPARATED
0.0/ 100
METRIC RATING
331st/ 347
METRIC RANK
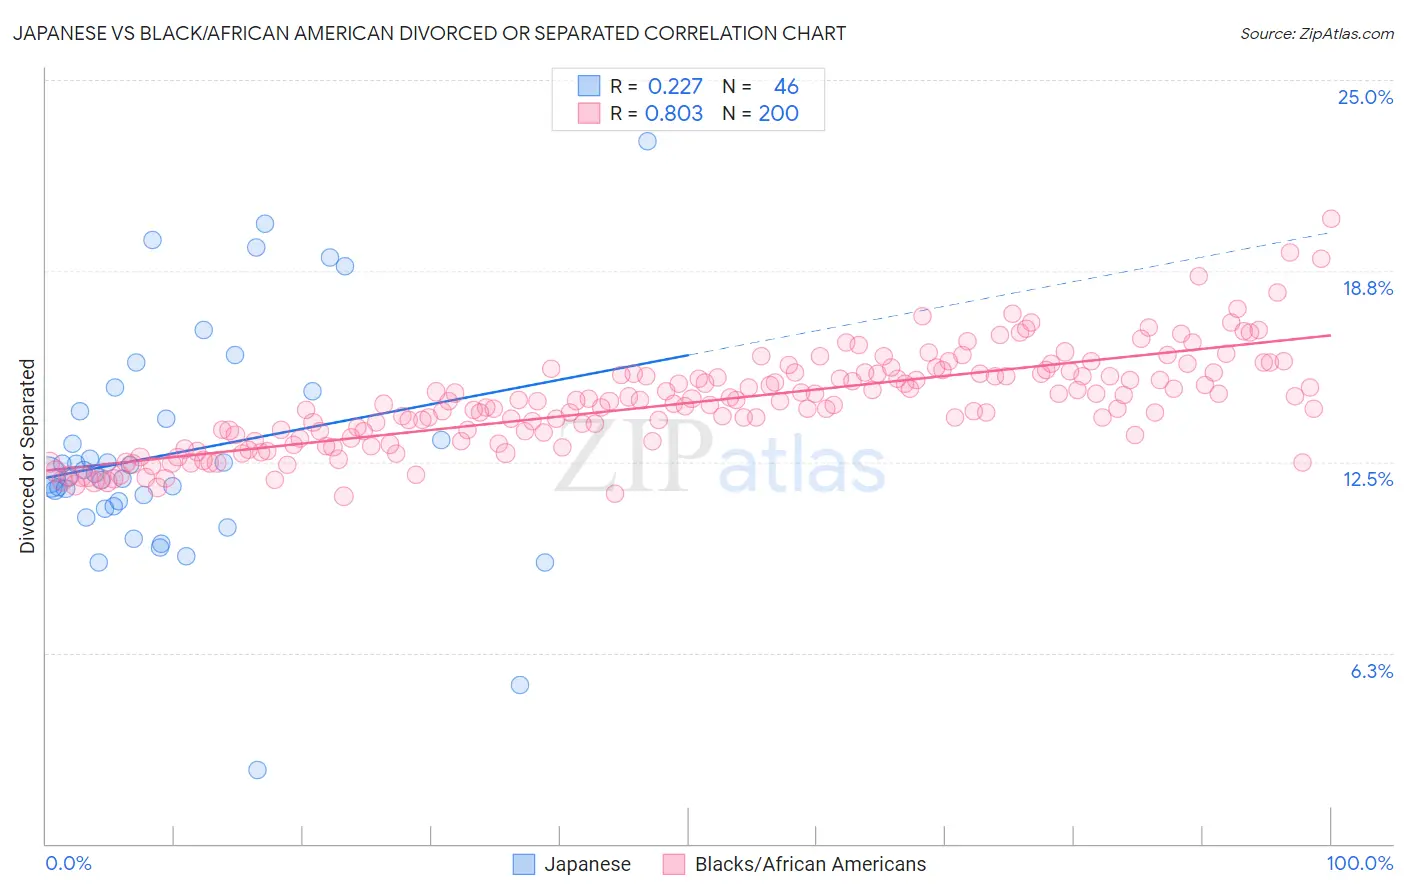
Japanese vs Black/African American Divorced or Separated Correlation Chart
The statistical analysis conducted on geographies consisting of 249,125,963 people shows a weak positive correlation between the proportion of Japanese and percentage of population currently divorced or separated in the United States with a correlation coefficient (R) of 0.227 and weighted average of 12.0%. Similarly, the statistical analysis conducted on geographies consisting of 565,552,203 people shows a very strong positive correlation between the proportion of Blacks/African Americans and percentage of population currently divorced or separated in the United States with a correlation coefficient (R) of 0.803 and weighted average of 13.6%, a difference of 13.9%.
Divorced or Separated Correlation Summary
| Measurement | Japanese | Black/African American |
| Minimum | 2.4% | 11.4% |
| Maximum | 23.0% | 20.4% |
| Range | 20.6% | 9.1% |
| Mean | 12.8% | 14.4% |
| Median | 12.1% | 14.4% |
| Interquartile 25% (IQ1) | 11.1% | 13.2% |
| Interquartile 75% (IQ3) | 14.1% | 15.4% |
| Interquartile Range (IQR) | 3.1% | 2.2% |
| Standard Deviation (Sample) | 3.8% | 1.6% |
| Standard Deviation (Population) | 3.7% | 1.6% |
Similar Demographics by Divorced or Separated
Demographics Similar to Japanese by Divorced or Separated
In terms of divorced or separated, the demographic groups most similar to Japanese are Chilean (12.0%, a difference of 0.020%), Hungarian (12.0%, a difference of 0.020%), Austrian (12.0%, a difference of 0.060%), Immigrants from Brazil (12.0%, a difference of 0.090%), and Immigrants from Hungary (11.9%, a difference of 0.12%).
| Demographics | Rating | Rank | Divorced or Separated |
| Italians | 77.8 /100 | #148 | Good 11.9% |
| Immigrants | Oceania | 77.7 /100 | #149 | Good 11.9% |
| Immigrants | Portugal | 77.3 /100 | #150 | Good 11.9% |
| Czechs | 76.4 /100 | #151 | Good 11.9% |
| Immigrants | Hungary | 73.7 /100 | #152 | Good 11.9% |
| Austrians | 72.2 /100 | #153 | Good 12.0% |
| Chileans | 71.3 /100 | #154 | Good 12.0% |
| Japanese | 70.9 /100 | #155 | Good 12.0% |
| Hungarians | 70.3 /100 | #156 | Good 12.0% |
| Immigrants | Brazil | 68.8 /100 | #157 | Good 12.0% |
| Icelanders | 66.0 /100 | #158 | Good 12.0% |
| Immigrants | Barbados | 66.0 /100 | #159 | Good 12.0% |
| Immigrants | Scotland | 65.8 /100 | #160 | Good 12.0% |
| Marshallese | 64.6 /100 | #161 | Good 12.0% |
| Samoans | 64.3 /100 | #162 | Good 12.0% |
Demographics Similar to Blacks/African Americans by Divorced or Separated
In terms of divorced or separated, the demographic groups most similar to Blacks/African Americans are Paiute (13.6%, a difference of 0.13%), Houma (13.6%, a difference of 0.24%), Immigrants from Caribbean (13.6%, a difference of 0.39%), Cherokee (13.7%, a difference of 0.76%), and Comanche (13.5%, a difference of 0.77%).
| Demographics | Rating | Rank | Divorced or Separated |
| Osage | 0.0 /100 | #324 | Tragic 13.4% |
| Potawatomi | 0.0 /100 | #325 | Tragic 13.5% |
| Immigrants | Congo | 0.0 /100 | #326 | Tragic 13.5% |
| Comanche | 0.0 /100 | #327 | Tragic 13.5% |
| Immigrants | Caribbean | 0.0 /100 | #328 | Tragic 13.6% |
| Houma | 0.0 /100 | #329 | Tragic 13.6% |
| Paiute | 0.0 /100 | #330 | Tragic 13.6% |
| Blacks/African Americans | 0.0 /100 | #331 | Tragic 13.6% |
| Cherokee | 0.0 /100 | #332 | Tragic 13.7% |
| Puerto Ricans | 0.0 /100 | #333 | Tragic 13.9% |
| Immigrants | Bahamas | 0.0 /100 | #334 | Tragic 13.9% |
| Dutch West Indians | 0.0 /100 | #335 | Tragic 14.0% |
| Shoshone | 0.0 /100 | #336 | Tragic 14.0% |
| Crow | 0.0 /100 | #337 | Tragic 14.1% |
| Choctaw | 0.0 /100 | #338 | Tragic 14.1% |