Jamaican vs Immigrants from Jamaica Average Family Size
COMPARE
Jamaican
Immigrants from Jamaica
Average Family Size
Average Family Size Comparison
Jamaicans
Immigrants from Jamaica
3.31
AVERAGE FAMILY SIZE
99.7/ 100
METRIC RATING
86th/ 347
METRIC RANK
3.33
AVERAGE FAMILY SIZE
99.9/ 100
METRIC RATING
67th/ 347
METRIC RANK
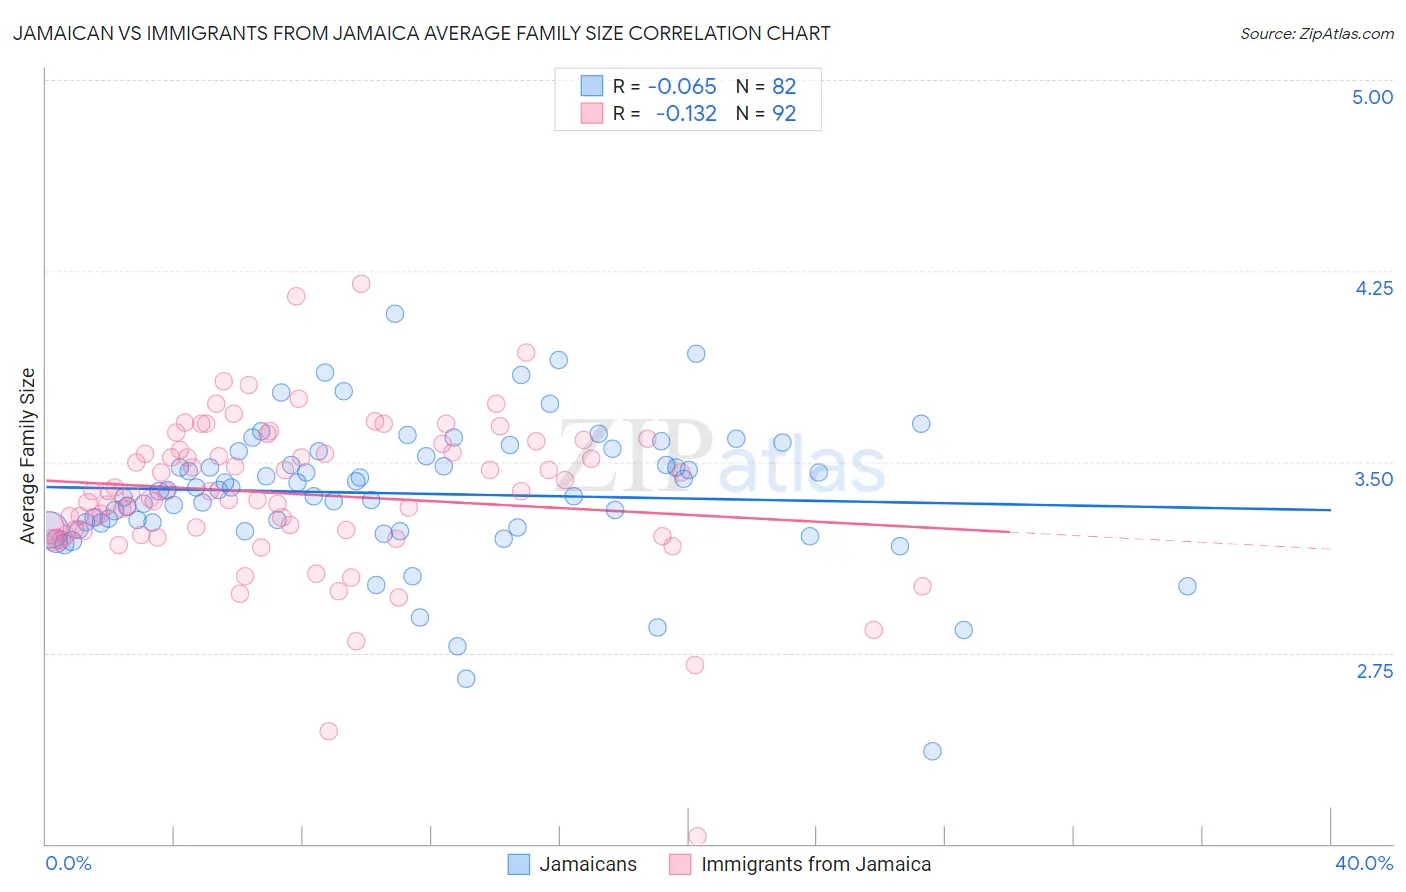
Jamaican vs Immigrants from Jamaica Average Family Size Correlation Chart
The statistical analysis conducted on geographies consisting of 367,646,796 people shows a slight negative correlation between the proportion of Jamaicans and average family size in the United States with a correlation coefficient (R) of -0.065 and weighted average of 3.31. Similarly, the statistical analysis conducted on geographies consisting of 301,591,194 people shows a poor negative correlation between the proportion of Immigrants from Jamaica and average family size in the United States with a correlation coefficient (R) of -0.132 and weighted average of 3.33, a difference of 0.63%.
Average Family Size Correlation Summary
| Measurement | Jamaican | Immigrants from Jamaica |
| Minimum | 2.36 | 2.03 |
| Maximum | 4.08 | 4.20 |
| Range | 1.72 | 2.17 |
| Mean | 3.38 | 3.37 |
| Median | 3.39 | 3.38 |
| Interquartile 25% (IQ1) | 3.24 | 3.22 |
| Interquartile 75% (IQ3) | 3.54 | 3.56 |
| Interquartile Range (IQR) | 0.30 | 0.34 |
| Standard Deviation (Sample) | 0.28 | 0.31 |
| Standard Deviation (Population) | 0.28 | 0.31 |
Demographics Similar to Jamaicans and Immigrants from Jamaica by Average Family Size
In terms of average family size, the demographic groups most similar to Jamaicans are Afghan (3.31, a difference of 0.020%), Immigrants from Nigeria (3.32, a difference of 0.060%), Immigrants from Afghanistan (3.32, a difference of 0.10%), Ecuadorian (3.32, a difference of 0.11%), and Immigrants from Dominica (3.32, a difference of 0.15%). Similarly, the demographic groups most similar to Immigrants from Jamaica are Immigrants from St. Vincent and the Grenadines (3.34, a difference of 0.040%), Immigrants from Cambodia (3.33, a difference of 0.080%), Immigrants (3.33, a difference of 0.11%), Immigrants from Trinidad and Tobago (3.33, a difference of 0.16%), and Immigrants from West Indies (3.33, a difference of 0.18%).
| Demographics | Rating | Rank | Average Family Size |
| Immigrants | St. Vincent and the Grenadines | 99.9 /100 | #66 | Exceptional 3.34 |
| Immigrants | Jamaica | 99.9 /100 | #67 | Exceptional 3.33 |
| Immigrants | Cambodia | 99.9 /100 | #68 | Exceptional 3.33 |
| Immigrants | Immigrants | 99.9 /100 | #69 | Exceptional 3.33 |
| Immigrants | Trinidad and Tobago | 99.9 /100 | #70 | Exceptional 3.33 |
| Immigrants | West Indies | 99.9 /100 | #71 | Exceptional 3.33 |
| Immigrants | Caribbean | 99.9 /100 | #72 | Exceptional 3.33 |
| Yaqui | 99.9 /100 | #73 | Exceptional 3.32 |
| Immigrants | Sierra Leone | 99.9 /100 | #74 | Exceptional 3.32 |
| Immigrants | Barbados | 99.8 /100 | #75 | Exceptional 3.32 |
| Trinidadians and Tobagonians | 99.8 /100 | #76 | Exceptional 3.32 |
| Immigrants | Ecuador | 99.8 /100 | #77 | Exceptional 3.32 |
| Immigrants | Micronesia | 99.8 /100 | #78 | Exceptional 3.32 |
| British West Indians | 99.8 /100 | #79 | Exceptional 3.32 |
| Lumbee | 99.8 /100 | #80 | Exceptional 3.32 |
| Immigrants | Dominica | 99.8 /100 | #81 | Exceptional 3.32 |
| Ecuadorians | 99.8 /100 | #82 | Exceptional 3.32 |
| Immigrants | Afghanistan | 99.8 /100 | #83 | Exceptional 3.32 |
| Immigrants | Nigeria | 99.7 /100 | #84 | Exceptional 3.32 |
| Afghans | 99.7 /100 | #85 | Exceptional 3.31 |
| Jamaicans | 99.7 /100 | #86 | Exceptional 3.31 |