Immigrants from Afghanistan vs Tongan Average Family Size
COMPARE
Immigrants from Afghanistan
Tongan
Average Family Size
Average Family Size Comparison
Immigrants from Afghanistan
Tongans
3.32
AVERAGE FAMILY SIZE
99.8/ 100
METRIC RATING
83rd/ 347
METRIC RANK
3.49
AVERAGE FAMILY SIZE
100.0/ 100
METRIC RATING
15th/ 347
METRIC RANK
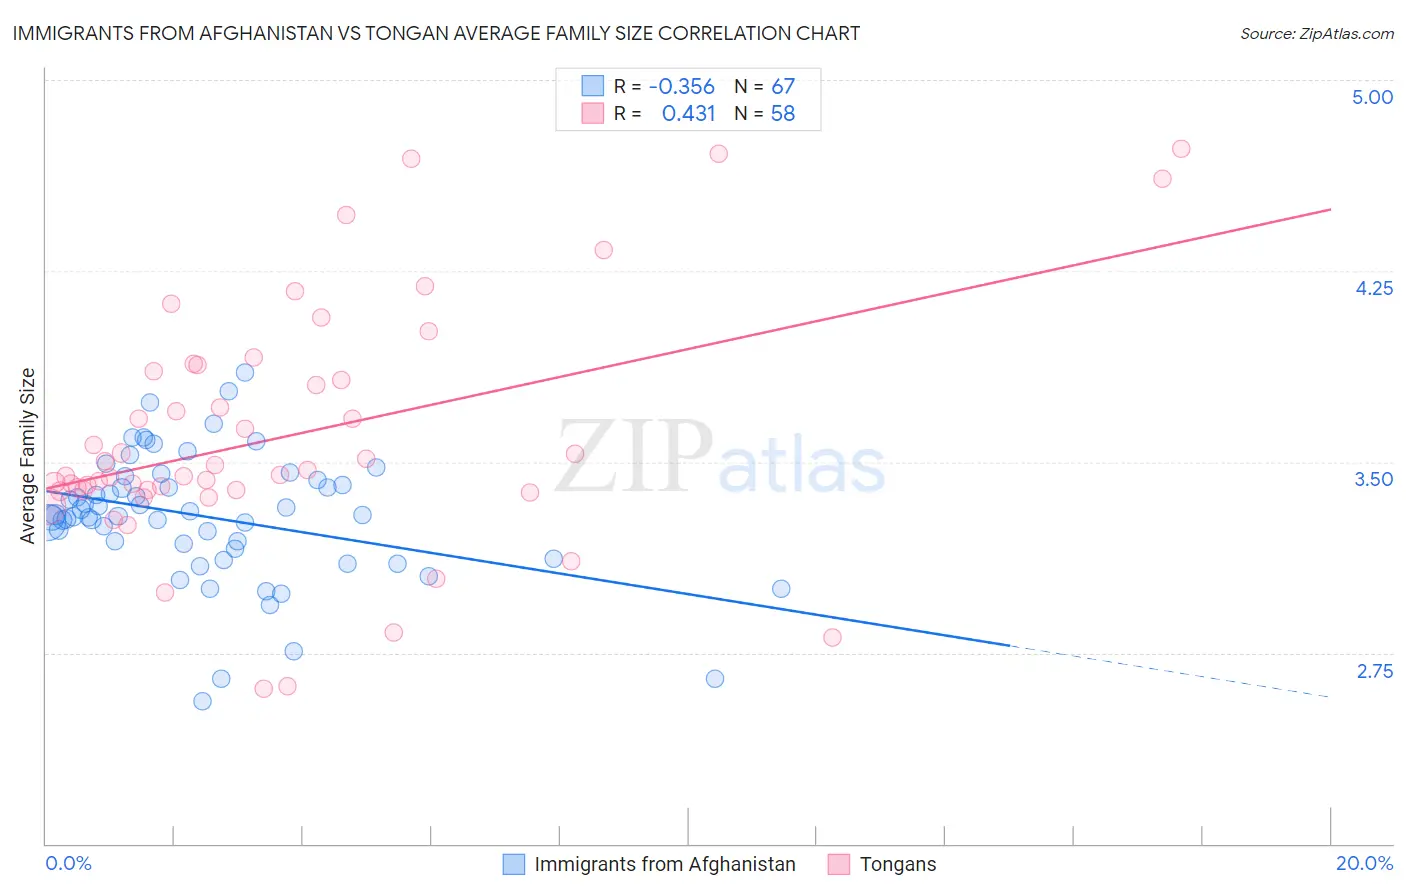
Immigrants from Afghanistan vs Tongan Average Family Size Correlation Chart
The statistical analysis conducted on geographies consisting of 147,621,409 people shows a mild negative correlation between the proportion of Immigrants from Afghanistan and average family size in the United States with a correlation coefficient (R) of -0.356 and weighted average of 3.32. Similarly, the statistical analysis conducted on geographies consisting of 102,872,564 people shows a moderate positive correlation between the proportion of Tongans and average family size in the United States with a correlation coefficient (R) of 0.431 and weighted average of 3.49, a difference of 5.3%.
Average Family Size Correlation Summary
| Measurement | Immigrants from Afghanistan | Tongan |
| Minimum | 2.56 | 2.61 |
| Maximum | 3.85 | 4.73 |
| Range | 1.29 | 2.12 |
| Mean | 3.28 | 3.60 |
| Median | 3.29 | 3.46 |
| Interquartile 25% (IQ1) | 3.16 | 3.39 |
| Interquartile 75% (IQ3) | 3.43 | 3.85 |
| Interquartile Range (IQR) | 0.27 | 0.47 |
| Standard Deviation (Sample) | 0.25 | 0.48 |
| Standard Deviation (Population) | 0.25 | 0.47 |
Similar Demographics by Average Family Size
Demographics Similar to Immigrants from Afghanistan by Average Family Size
In terms of average family size, the demographic groups most similar to Immigrants from Afghanistan are Ecuadorian (3.32, a difference of 0.010%), Immigrants from Nigeria (3.32, a difference of 0.030%), Immigrants from Dominica (3.32, a difference of 0.050%), Afghan (3.31, a difference of 0.080%), and Lumbee (3.32, a difference of 0.090%).
| Demographics | Rating | Rank | Average Family Size |
| Trinidadians and Tobagonians | 99.8 /100 | #76 | Exceptional 3.32 |
| Immigrants | Ecuador | 99.8 /100 | #77 | Exceptional 3.32 |
| Immigrants | Micronesia | 99.8 /100 | #78 | Exceptional 3.32 |
| British West Indians | 99.8 /100 | #79 | Exceptional 3.32 |
| Lumbee | 99.8 /100 | #80 | Exceptional 3.32 |
| Immigrants | Dominica | 99.8 /100 | #81 | Exceptional 3.32 |
| Ecuadorians | 99.8 /100 | #82 | Exceptional 3.32 |
| Immigrants | Afghanistan | 99.8 /100 | #83 | Exceptional 3.32 |
| Immigrants | Nigeria | 99.7 /100 | #84 | Exceptional 3.32 |
| Afghans | 99.7 /100 | #85 | Exceptional 3.31 |
| Jamaicans | 99.7 /100 | #86 | Exceptional 3.31 |
| Immigrants | Peru | 99.7 /100 | #87 | Exceptional 3.31 |
| Immigrants | Bolivia | 99.6 /100 | #88 | Exceptional 3.31 |
| Malaysians | 99.6 /100 | #89 | Exceptional 3.31 |
| Menominee | 99.4 /100 | #90 | Exceptional 3.30 |
Demographics Similar to Tongans by Average Family Size
In terms of average family size, the demographic groups most similar to Tongans are Immigrants from Central America (3.49, a difference of 0.050%), Ute (3.49, a difference of 0.060%), Immigrants from El Salvador (3.49, a difference of 0.15%), Salvadoran (3.48, a difference of 0.40%), and Mexican (3.48, a difference of 0.46%).
| Demographics | Rating | Rank | Average Family Size |
| Immigrants | Yemen | 100.0 /100 | #8 | Exceptional 3.60 |
| Hopi | 100.0 /100 | #9 | Exceptional 3.60 |
| Spanish American Indians | 100.0 /100 | #10 | Exceptional 3.58 |
| Tohono O'odham | 100.0 /100 | #11 | Exceptional 3.53 |
| Immigrants | Mexico | 100.0 /100 | #12 | Exceptional 3.52 |
| Sioux | 100.0 /100 | #13 | Exceptional 3.52 |
| Immigrants | Central America | 100.0 /100 | #14 | Exceptional 3.49 |
| Tongans | 100.0 /100 | #15 | Exceptional 3.49 |
| Ute | 100.0 /100 | #16 | Exceptional 3.49 |
| Immigrants | El Salvador | 100.0 /100 | #17 | Exceptional 3.49 |
| Salvadorans | 100.0 /100 | #18 | Exceptional 3.48 |
| Mexicans | 100.0 /100 | #19 | Exceptional 3.48 |
| Cheyenne | 100.0 /100 | #20 | Exceptional 3.47 |
| Yuman | 100.0 /100 | #21 | Exceptional 3.47 |
| Apache | 100.0 /100 | #22 | Exceptional 3.46 |