Immigrants from Zaire vs Tongan Average Family Size
COMPARE
Immigrants from Zaire
Tongan
Average Family Size
Average Family Size Comparison
Immigrants from Zaire
Tongans
3.22
AVERAGE FAMILY SIZE
30.5/ 100
METRIC RATING
191st/ 347
METRIC RANK
3.49
AVERAGE FAMILY SIZE
100.0/ 100
METRIC RATING
15th/ 347
METRIC RANK
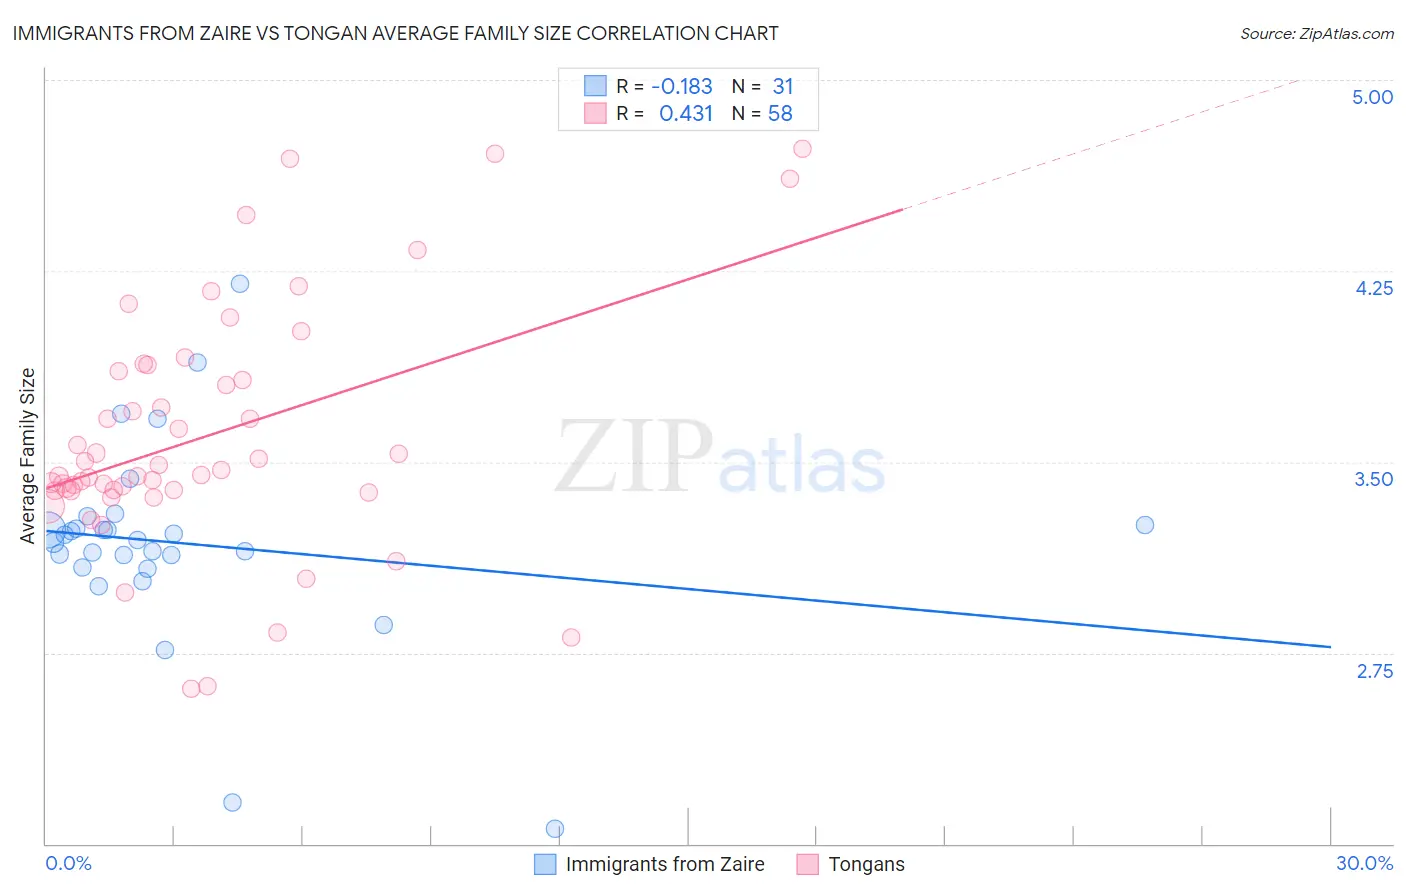
Immigrants from Zaire vs Tongan Average Family Size Correlation Chart
The statistical analysis conducted on geographies consisting of 107,246,225 people shows a poor negative correlation between the proportion of Immigrants from Zaire and average family size in the United States with a correlation coefficient (R) of -0.183 and weighted average of 3.22. Similarly, the statistical analysis conducted on geographies consisting of 102,872,564 people shows a moderate positive correlation between the proportion of Tongans and average family size in the United States with a correlation coefficient (R) of 0.431 and weighted average of 3.49, a difference of 8.6%.
Average Family Size Correlation Summary
| Measurement | Immigrants from Zaire | Tongan |
| Minimum | 2.06 | 2.61 |
| Maximum | 4.20 | 4.73 |
| Range | 2.14 | 2.12 |
| Mean | 3.18 | 3.60 |
| Median | 3.19 | 3.46 |
| Interquartile 25% (IQ1) | 3.08 | 3.39 |
| Interquartile 75% (IQ3) | 3.25 | 3.85 |
| Interquartile Range (IQR) | 0.17 | 0.47 |
| Standard Deviation (Sample) | 0.40 | 0.48 |
| Standard Deviation (Population) | 0.39 | 0.47 |
Similar Demographics by Average Family Size
Demographics Similar to Immigrants from Zaire by Average Family Size
In terms of average family size, the demographic groups most similar to Immigrants from Zaire are Burmese (3.22, a difference of 0.010%), Immigrants from Eastern Africa (3.22, a difference of 0.010%), Immigrants from Israel (3.22, a difference of 0.030%), Immigrants from Sudan (3.22, a difference of 0.030%), and Choctaw (3.21, a difference of 0.050%).
| Demographics | Rating | Rank | Average Family Size |
| Immigrants | Eastern Asia | 40.8 /100 | #184 | Average 3.22 |
| Immigrants | Sri Lanka | 39.8 /100 | #185 | Fair 3.22 |
| Immigrants | Argentina | 39.8 /100 | #186 | Fair 3.22 |
| Immigrants | Malaysia | 39.0 /100 | #187 | Fair 3.22 |
| Thais | 38.3 /100 | #188 | Fair 3.22 |
| Pakistanis | 33.7 /100 | #189 | Fair 3.22 |
| Burmese | 31.0 /100 | #190 | Fair 3.22 |
| Immigrants | Zaire | 30.5 /100 | #191 | Fair 3.22 |
| Immigrants | Eastern Africa | 30.1 /100 | #192 | Fair 3.22 |
| Immigrants | Israel | 29.3 /100 | #193 | Fair 3.22 |
| Immigrants | Sudan | 29.1 /100 | #194 | Fair 3.22 |
| Choctaw | 28.3 /100 | #195 | Fair 3.21 |
| Senegalese | 28.2 /100 | #196 | Fair 3.21 |
| Kenyans | 28.0 /100 | #197 | Fair 3.21 |
| Immigrants | Azores | 21.7 /100 | #198 | Fair 3.21 |
Demographics Similar to Tongans by Average Family Size
In terms of average family size, the demographic groups most similar to Tongans are Immigrants from Central America (3.49, a difference of 0.050%), Ute (3.49, a difference of 0.060%), Immigrants from El Salvador (3.49, a difference of 0.15%), Salvadoran (3.48, a difference of 0.40%), and Mexican (3.48, a difference of 0.46%).
| Demographics | Rating | Rank | Average Family Size |
| Immigrants | Yemen | 100.0 /100 | #8 | Exceptional 3.60 |
| Hopi | 100.0 /100 | #9 | Exceptional 3.60 |
| Spanish American Indians | 100.0 /100 | #10 | Exceptional 3.58 |
| Tohono O'odham | 100.0 /100 | #11 | Exceptional 3.53 |
| Immigrants | Mexico | 100.0 /100 | #12 | Exceptional 3.52 |
| Sioux | 100.0 /100 | #13 | Exceptional 3.52 |
| Immigrants | Central America | 100.0 /100 | #14 | Exceptional 3.49 |
| Tongans | 100.0 /100 | #15 | Exceptional 3.49 |
| Ute | 100.0 /100 | #16 | Exceptional 3.49 |
| Immigrants | El Salvador | 100.0 /100 | #17 | Exceptional 3.49 |
| Salvadorans | 100.0 /100 | #18 | Exceptional 3.48 |
| Mexicans | 100.0 /100 | #19 | Exceptional 3.48 |
| Cheyenne | 100.0 /100 | #20 | Exceptional 3.47 |
| Yuman | 100.0 /100 | #21 | Exceptional 3.47 |
| Apache | 100.0 /100 | #22 | Exceptional 3.46 |