Jamaican vs Potawatomi Average Family Size
COMPARE
Jamaican
Potawatomi
Average Family Size
Average Family Size Comparison
Jamaicans
Potawatomi
3.31
AVERAGE FAMILY SIZE
99.7/ 100
METRIC RATING
86th/ 347
METRIC RANK
3.16
AVERAGE FAMILY SIZE
1.3/ 100
METRIC RATING
259th/ 347
METRIC RANK
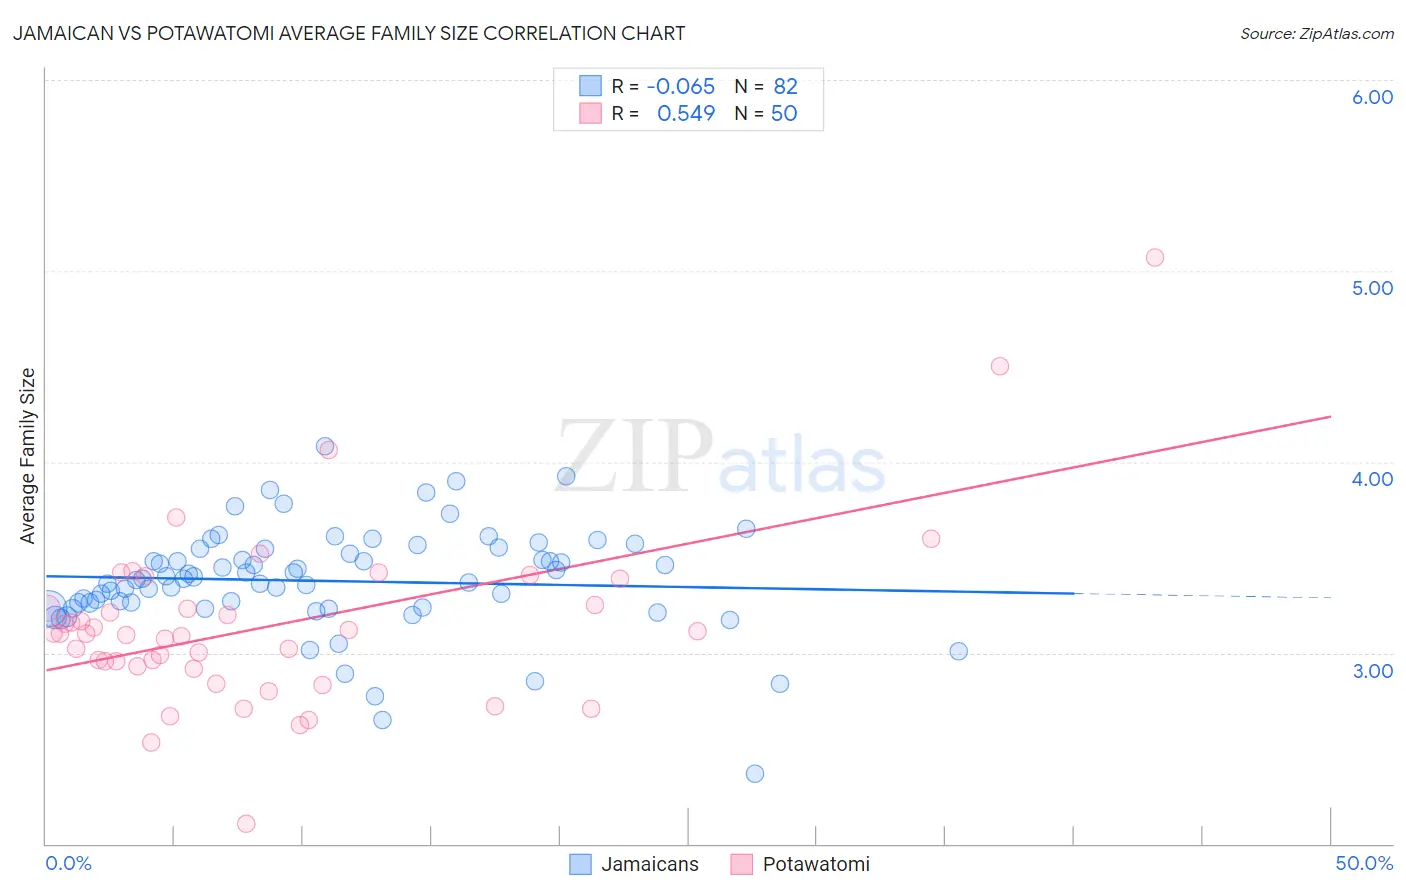
Jamaican vs Potawatomi Average Family Size Correlation Chart
The statistical analysis conducted on geographies consisting of 367,646,796 people shows a slight negative correlation between the proportion of Jamaicans and average family size in the United States with a correlation coefficient (R) of -0.065 and weighted average of 3.31. Similarly, the statistical analysis conducted on geographies consisting of 117,759,864 people shows a substantial positive correlation between the proportion of Potawatomi and average family size in the United States with a correlation coefficient (R) of 0.549 and weighted average of 3.16, a difference of 4.7%.
Average Family Size Correlation Summary
| Measurement | Jamaican | Potawatomi |
| Minimum | 2.36 | 2.10 |
| Maximum | 4.08 | 5.07 |
| Range | 1.72 | 2.97 |
| Mean | 3.38 | 3.15 |
| Median | 3.39 | 3.10 |
| Interquartile 25% (IQ1) | 3.24 | 2.93 |
| Interquartile 75% (IQ3) | 3.54 | 3.25 |
| Interquartile Range (IQR) | 0.30 | 0.32 |
| Standard Deviation (Sample) | 0.28 | 0.47 |
| Standard Deviation (Population) | 0.28 | 0.47 |
Similar Demographics by Average Family Size
Demographics Similar to Jamaicans by Average Family Size
In terms of average family size, the demographic groups most similar to Jamaicans are Afghan (3.31, a difference of 0.020%), Immigrants from Peru (3.31, a difference of 0.050%), Immigrants from Nigeria (3.32, a difference of 0.060%), Immigrants from Afghanistan (3.32, a difference of 0.10%), and Ecuadorian (3.32, a difference of 0.11%).
| Demographics | Rating | Rank | Average Family Size |
| British West Indians | 99.8 /100 | #79 | Exceptional 3.32 |
| Lumbee | 99.8 /100 | #80 | Exceptional 3.32 |
| Immigrants | Dominica | 99.8 /100 | #81 | Exceptional 3.32 |
| Ecuadorians | 99.8 /100 | #82 | Exceptional 3.32 |
| Immigrants | Afghanistan | 99.8 /100 | #83 | Exceptional 3.32 |
| Immigrants | Nigeria | 99.7 /100 | #84 | Exceptional 3.32 |
| Afghans | 99.7 /100 | #85 | Exceptional 3.31 |
| Jamaicans | 99.7 /100 | #86 | Exceptional 3.31 |
| Immigrants | Peru | 99.7 /100 | #87 | Exceptional 3.31 |
| Immigrants | Bolivia | 99.6 /100 | #88 | Exceptional 3.31 |
| Malaysians | 99.6 /100 | #89 | Exceptional 3.31 |
| Menominee | 99.4 /100 | #90 | Exceptional 3.30 |
| Immigrants | Pakistan | 99.2 /100 | #91 | Exceptional 3.30 |
| Immigrants | Cameroon | 99.2 /100 | #92 | Exceptional 3.30 |
| Peruvians | 99.2 /100 | #93 | Exceptional 3.30 |
Demographics Similar to Potawatomi by Average Family Size
In terms of average family size, the demographic groups most similar to Potawatomi are Turkish (3.16, a difference of 0.0%), Immigrants from Albania (3.16, a difference of 0.0%), Immigrants from North Macedonia (3.16, a difference of 0.010%), Immigrants from Russia (3.16, a difference of 0.020%), and Albanian (3.17, a difference of 0.050%).
| Demographics | Rating | Rank | Average Family Size |
| Immigrants | Saudi Arabia | 1.7 /100 | #252 | Tragic 3.17 |
| South Africans | 1.7 /100 | #253 | Tragic 3.17 |
| Immigrants | Hungary | 1.7 /100 | #254 | Tragic 3.17 |
| Cape Verdeans | 1.6 /100 | #255 | Tragic 3.17 |
| Immigrants | Kazakhstan | 1.5 /100 | #256 | Tragic 3.17 |
| Albanians | 1.5 /100 | #257 | Tragic 3.17 |
| Turks | 1.3 /100 | #258 | Tragic 3.16 |
| Potawatomi | 1.3 /100 | #259 | Tragic 3.16 |
| Immigrants | Albania | 1.3 /100 | #260 | Tragic 3.16 |
| Immigrants | North Macedonia | 1.3 /100 | #261 | Tragic 3.16 |
| Immigrants | Russia | 1.3 /100 | #262 | Tragic 3.16 |
| Immigrants | Bulgaria | 1.0 /100 | #263 | Tragic 3.16 |
| Americans | 1.0 /100 | #264 | Tragic 3.16 |
| Immigrants | South Africa | 0.9 /100 | #265 | Tragic 3.16 |
| Immigrants | Greece | 0.9 /100 | #266 | Tragic 3.16 |