Jamaican vs Irish Average Family Size
COMPARE
Jamaican
Irish
Average Family Size
Average Family Size Comparison
Jamaicans
Irish
3.31
AVERAGE FAMILY SIZE
99.7/ 100
METRIC RATING
86th/ 347
METRIC RANK
3.10
AVERAGE FAMILY SIZE
0.0/ 100
METRIC RATING
336th/ 347
METRIC RANK
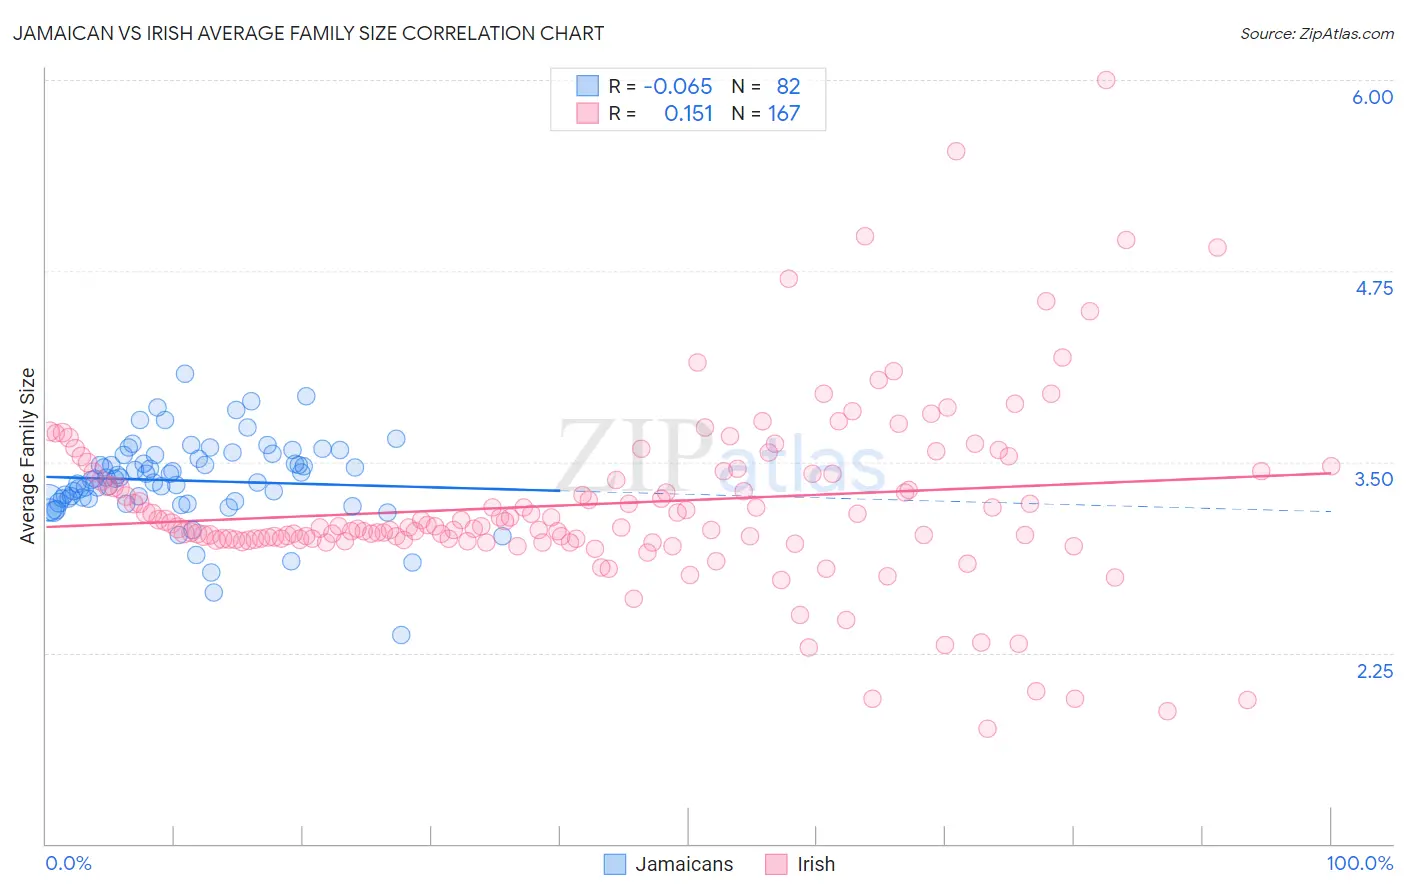
Jamaican vs Irish Average Family Size Correlation Chart
The statistical analysis conducted on geographies consisting of 367,646,796 people shows a slight negative correlation between the proportion of Jamaicans and average family size in the United States with a correlation coefficient (R) of -0.065 and weighted average of 3.31. Similarly, the statistical analysis conducted on geographies consisting of 580,016,096 people shows a poor positive correlation between the proportion of Irish and average family size in the United States with a correlation coefficient (R) of 0.151 and weighted average of 3.10, a difference of 6.9%.
Average Family Size Correlation Summary
| Measurement | Jamaican | Irish |
| Minimum | 2.36 | 1.75 |
| Maximum | 4.08 | 6.00 |
| Range | 1.72 | 4.25 |
| Mean | 3.38 | 3.22 |
| Median | 3.39 | 3.08 |
| Interquartile 25% (IQ1) | 3.24 | 2.99 |
| Interquartile 75% (IQ3) | 3.54 | 3.43 |
| Interquartile Range (IQR) | 0.30 | 0.44 |
| Standard Deviation (Sample) | 0.28 | 0.59 |
| Standard Deviation (Population) | 0.28 | 0.59 |
Similar Demographics by Average Family Size
Demographics Similar to Jamaicans by Average Family Size
In terms of average family size, the demographic groups most similar to Jamaicans are Afghan (3.31, a difference of 0.020%), Immigrants from Peru (3.31, a difference of 0.050%), Immigrants from Nigeria (3.32, a difference of 0.060%), Immigrants from Afghanistan (3.32, a difference of 0.10%), and Ecuadorian (3.32, a difference of 0.11%).
| Demographics | Rating | Rank | Average Family Size |
| British West Indians | 99.8 /100 | #79 | Exceptional 3.32 |
| Lumbee | 99.8 /100 | #80 | Exceptional 3.32 |
| Immigrants | Dominica | 99.8 /100 | #81 | Exceptional 3.32 |
| Ecuadorians | 99.8 /100 | #82 | Exceptional 3.32 |
| Immigrants | Afghanistan | 99.8 /100 | #83 | Exceptional 3.32 |
| Immigrants | Nigeria | 99.7 /100 | #84 | Exceptional 3.32 |
| Afghans | 99.7 /100 | #85 | Exceptional 3.31 |
| Jamaicans | 99.7 /100 | #86 | Exceptional 3.31 |
| Immigrants | Peru | 99.7 /100 | #87 | Exceptional 3.31 |
| Immigrants | Bolivia | 99.6 /100 | #88 | Exceptional 3.31 |
| Malaysians | 99.6 /100 | #89 | Exceptional 3.31 |
| Menominee | 99.4 /100 | #90 | Exceptional 3.30 |
| Immigrants | Pakistan | 99.2 /100 | #91 | Exceptional 3.30 |
| Immigrants | Cameroon | 99.2 /100 | #92 | Exceptional 3.30 |
| Peruvians | 99.2 /100 | #93 | Exceptional 3.30 |
Demographics Similar to Irish by Average Family Size
In terms of average family size, the demographic groups most similar to Irish are Swedish (3.10, a difference of 0.030%), Luxembourger (3.10, a difference of 0.060%), French (3.10, a difference of 0.060%), Croatian (3.10, a difference of 0.070%), and Estonian (3.10, a difference of 0.090%).
| Demographics | Rating | Rank | Average Family Size |
| Belgians | 0.0 /100 | #329 | Tragic 3.11 |
| Latvians | 0.0 /100 | #330 | Tragic 3.11 |
| Scotch-Irish | 0.0 /100 | #331 | Tragic 3.11 |
| Scottish | 0.0 /100 | #332 | Tragic 3.11 |
| Estonians | 0.0 /100 | #333 | Tragic 3.10 |
| Lithuanians | 0.0 /100 | #334 | Tragic 3.10 |
| Luxembourgers | 0.0 /100 | #335 | Tragic 3.10 |
| Irish | 0.0 /100 | #336 | Tragic 3.10 |
| Swedes | 0.0 /100 | #337 | Tragic 3.10 |
| French | 0.0 /100 | #338 | Tragic 3.10 |
| Croatians | 0.0 /100 | #339 | Tragic 3.10 |
| Finns | 0.0 /100 | #340 | Tragic 3.09 |
| Poles | 0.0 /100 | #341 | Tragic 3.09 |
| Germans | 0.0 /100 | #342 | Tragic 3.09 |
| Norwegians | 0.0 /100 | #343 | Tragic 3.08 |