Jamaican vs Bermudan Average Family Size
COMPARE
Jamaican
Bermudan
Average Family Size
Average Family Size Comparison
Jamaicans
Bermudans
3.31
AVERAGE FAMILY SIZE
99.7/ 100
METRIC RATING
86th/ 347
METRIC RANK
3.20
AVERAGE FAMILY SIZE
11.0/ 100
METRIC RATING
216th/ 347
METRIC RANK
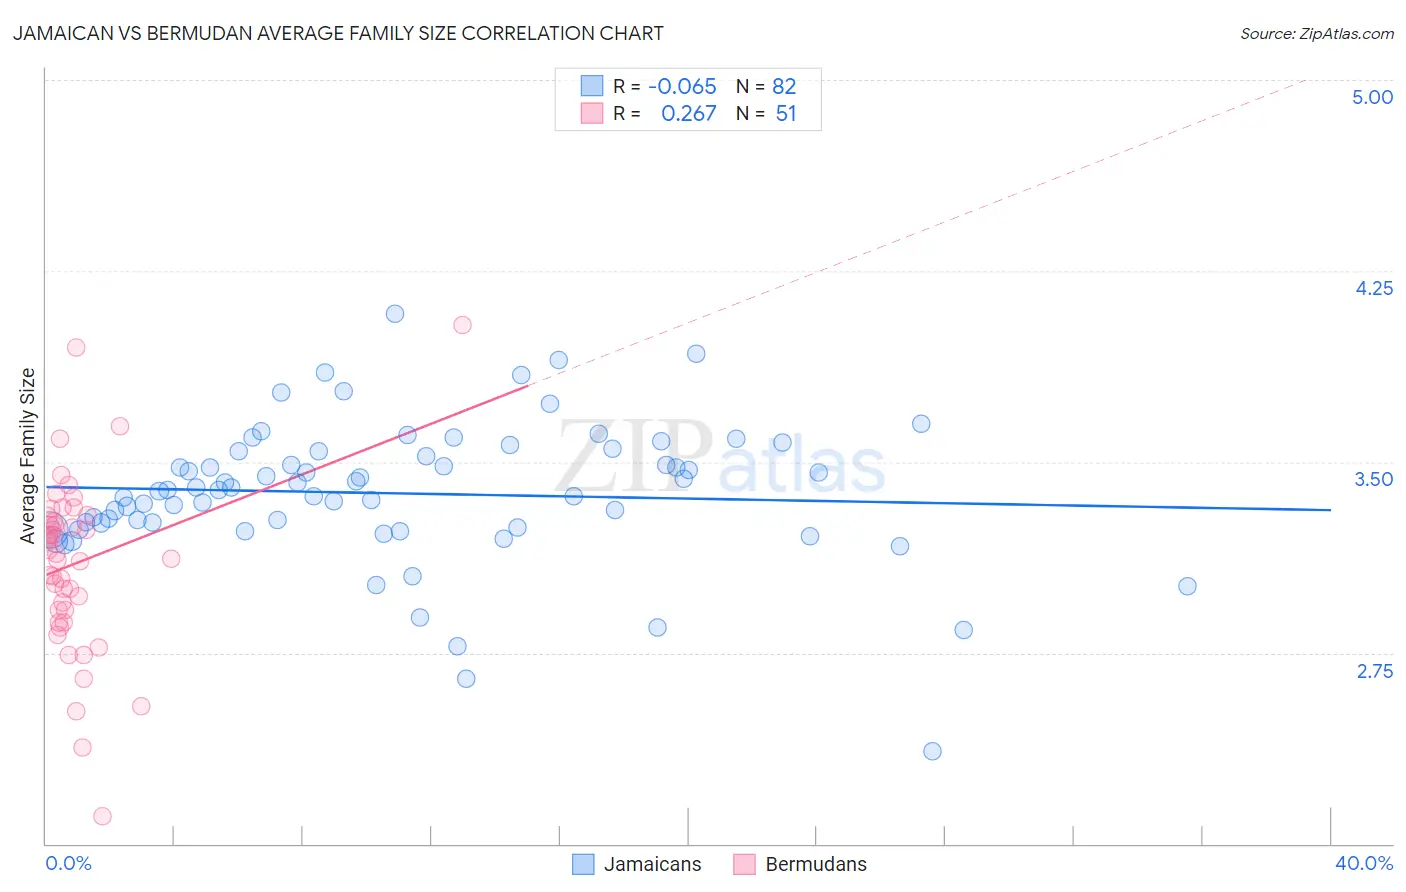
Jamaican vs Bermudan Average Family Size Correlation Chart
The statistical analysis conducted on geographies consisting of 367,646,796 people shows a slight negative correlation between the proportion of Jamaicans and average family size in the United States with a correlation coefficient (R) of -0.065 and weighted average of 3.31. Similarly, the statistical analysis conducted on geographies consisting of 55,716,155 people shows a weak positive correlation between the proportion of Bermudans and average family size in the United States with a correlation coefficient (R) of 0.267 and weighted average of 3.20, a difference of 3.6%.
Average Family Size Correlation Summary
| Measurement | Jamaican | Bermudan |
| Minimum | 2.36 | 2.11 |
| Maximum | 4.08 | 4.04 |
| Range | 1.72 | 1.93 |
| Mean | 3.38 | 3.10 |
| Median | 3.39 | 3.14 |
| Interquartile 25% (IQ1) | 3.24 | 2.92 |
| Interquartile 75% (IQ3) | 3.54 | 3.28 |
| Interquartile Range (IQR) | 0.30 | 0.36 |
| Standard Deviation (Sample) | 0.28 | 0.35 |
| Standard Deviation (Population) | 0.28 | 0.34 |
Similar Demographics by Average Family Size
Demographics Similar to Jamaicans by Average Family Size
In terms of average family size, the demographic groups most similar to Jamaicans are Afghan (3.31, a difference of 0.020%), Immigrants from Peru (3.31, a difference of 0.050%), Immigrants from Nigeria (3.32, a difference of 0.060%), Immigrants from Afghanistan (3.32, a difference of 0.10%), and Ecuadorian (3.32, a difference of 0.11%).
| Demographics | Rating | Rank | Average Family Size |
| British West Indians | 99.8 /100 | #79 | Exceptional 3.32 |
| Lumbee | 99.8 /100 | #80 | Exceptional 3.32 |
| Immigrants | Dominica | 99.8 /100 | #81 | Exceptional 3.32 |
| Ecuadorians | 99.8 /100 | #82 | Exceptional 3.32 |
| Immigrants | Afghanistan | 99.8 /100 | #83 | Exceptional 3.32 |
| Immigrants | Nigeria | 99.7 /100 | #84 | Exceptional 3.32 |
| Afghans | 99.7 /100 | #85 | Exceptional 3.31 |
| Jamaicans | 99.7 /100 | #86 | Exceptional 3.31 |
| Immigrants | Peru | 99.7 /100 | #87 | Exceptional 3.31 |
| Immigrants | Bolivia | 99.6 /100 | #88 | Exceptional 3.31 |
| Malaysians | 99.6 /100 | #89 | Exceptional 3.31 |
| Menominee | 99.4 /100 | #90 | Exceptional 3.30 |
| Immigrants | Pakistan | 99.2 /100 | #91 | Exceptional 3.30 |
| Immigrants | Cameroon | 99.2 /100 | #92 | Exceptional 3.30 |
| Peruvians | 99.2 /100 | #93 | Exceptional 3.30 |
Demographics Similar to Bermudans by Average Family Size
In terms of average family size, the demographic groups most similar to Bermudans are Delaware (3.20, a difference of 0.0%), Somali (3.20, a difference of 0.010%), Mongolian (3.20, a difference of 0.030%), Immigrants from Somalia (3.20, a difference of 0.030%), and Immigrants from Iran (3.20, a difference of 0.050%).
| Demographics | Rating | Rank | Average Family Size |
| Sudanese | 13.3 /100 | #209 | Poor 3.20 |
| Zimbabweans | 12.6 /100 | #210 | Poor 3.20 |
| Immigrants | Iran | 12.1 /100 | #211 | Poor 3.20 |
| Creek | 12.1 /100 | #212 | Poor 3.20 |
| Mongolians | 11.5 /100 | #213 | Poor 3.20 |
| Somalis | 11.2 /100 | #214 | Poor 3.20 |
| Delaware | 11.1 /100 | #215 | Poor 3.20 |
| Bermudans | 11.0 /100 | #216 | Poor 3.20 |
| Immigrants | Somalia | 10.3 /100 | #217 | Poor 3.20 |
| French American Indians | 9.8 /100 | #218 | Tragic 3.20 |
| Pennsylvania Germans | 9.3 /100 | #219 | Tragic 3.19 |
| Lebanese | 9.1 /100 | #220 | Tragic 3.19 |
| Immigrants | Ukraine | 7.2 /100 | #221 | Tragic 3.19 |
| Immigrants | Kuwait | 7.2 /100 | #222 | Tragic 3.19 |
| Immigrants | Zimbabwe | 7.1 /100 | #223 | Tragic 3.19 |