Iroquois vs Fijian Divorced or Separated
COMPARE
Iroquois
Fijian
Divorced or Separated
Divorced or Separated Comparison
Iroquois
Fijians
12.9%
DIVORCED OR SEPARATED
0.0/ 100
METRIC RATING
289th/ 347
METRIC RANK
12.6%
DIVORCED OR SEPARATED
0.4/ 100
METRIC RATING
268th/ 347
METRIC RANK
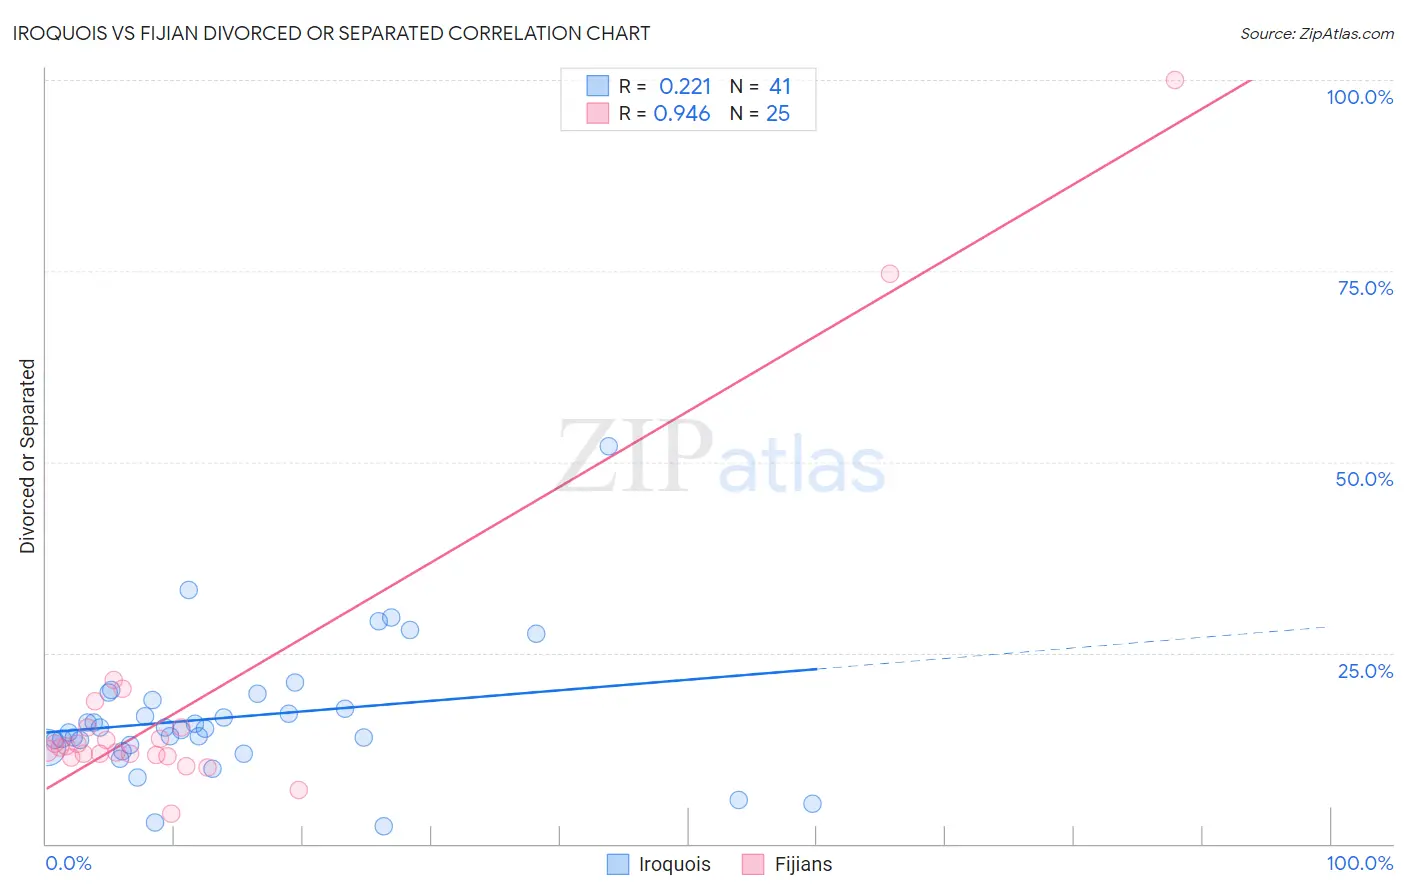
Iroquois vs Fijian Divorced or Separated Correlation Chart
The statistical analysis conducted on geographies consisting of 207,262,032 people shows a weak positive correlation between the proportion of Iroquois and percentage of population currently divorced or separated in the United States with a correlation coefficient (R) of 0.221 and weighted average of 12.9%. Similarly, the statistical analysis conducted on geographies consisting of 55,948,408 people shows a near-perfect positive correlation between the proportion of Fijians and percentage of population currently divorced or separated in the United States with a correlation coefficient (R) of 0.946 and weighted average of 12.6%, a difference of 1.9%.
Divorced or Separated Correlation Summary
| Measurement | Iroquois | Fijian |
| Minimum | 2.3% | 4.0% |
| Maximum | 52.0% | 100.0% |
| Range | 49.7% | 96.0% |
| Mean | 16.6% | 18.8% |
| Median | 15.0% | 12.6% |
| Interquartile 25% (IQ1) | 12.8% | 11.6% |
| Interquartile 75% (IQ3) | 19.2% | 15.3% |
| Interquartile Range (IQR) | 6.4% | 3.7% |
| Standard Deviation (Sample) | 8.8% | 21.3% |
| Standard Deviation (Population) | 8.7% | 20.8% |
Similar Demographics by Divorced or Separated
Demographics Similar to Iroquois by Divorced or Separated
In terms of divorced or separated, the demographic groups most similar to Iroquois are Pima (12.9%, a difference of 0.14%), French Canadian (12.8%, a difference of 0.15%), Immigrants from Honduras (12.9%, a difference of 0.26%), Scotch-Irish (12.9%, a difference of 0.32%), and Honduran (12.8%, a difference of 0.41%).
| Demographics | Rating | Rank | Divorced or Separated |
| Sub-Saharan Africans | 0.1 /100 | #282 | Tragic 12.7% |
| Delaware | 0.1 /100 | #283 | Tragic 12.7% |
| Immigrants | Nonimmigrants | 0.1 /100 | #284 | Tragic 12.8% |
| French | 0.1 /100 | #285 | Tragic 12.8% |
| Spanish | 0.1 /100 | #286 | Tragic 12.8% |
| Hondurans | 0.1 /100 | #287 | Tragic 12.8% |
| French Canadians | 0.1 /100 | #288 | Tragic 12.8% |
| Iroquois | 0.0 /100 | #289 | Tragic 12.9% |
| Pima | 0.0 /100 | #290 | Tragic 12.9% |
| Immigrants | Honduras | 0.0 /100 | #291 | Tragic 12.9% |
| Scotch-Irish | 0.0 /100 | #292 | Tragic 12.9% |
| Jamaicans | 0.0 /100 | #293 | Tragic 12.9% |
| Apache | 0.0 /100 | #294 | Tragic 12.9% |
| Celtics | 0.0 /100 | #295 | Tragic 13.0% |
| Nicaraguans | 0.0 /100 | #296 | Tragic 13.0% |
Demographics Similar to Fijians by Divorced or Separated
In terms of divorced or separated, the demographic groups most similar to Fijians are Scottish (12.6%, a difference of 0.010%), Immigrants from Liberia (12.6%, a difference of 0.010%), White/Caucasian (12.6%, a difference of 0.060%), Immigrants from Senegal (12.6%, a difference of 0.070%), and English (12.6%, a difference of 0.080%).
| Demographics | Rating | Rank | Divorced or Separated |
| Immigrants | Dominica | 0.5 /100 | #261 | Tragic 12.6% |
| Basques | 0.5 /100 | #262 | Tragic 12.6% |
| Immigrants | Panama | 0.5 /100 | #263 | Tragic 12.6% |
| English | 0.5 /100 | #264 | Tragic 12.6% |
| Immigrants | Senegal | 0.5 /100 | #265 | Tragic 12.6% |
| Whites/Caucasians | 0.5 /100 | #266 | Tragic 12.6% |
| Scottish | 0.4 /100 | #267 | Tragic 12.6% |
| Fijians | 0.4 /100 | #268 | Tragic 12.6% |
| Immigrants | Liberia | 0.4 /100 | #269 | Tragic 12.6% |
| Ute | 0.4 /100 | #270 | Tragic 12.6% |
| Panamanians | 0.3 /100 | #271 | Tragic 12.7% |
| Immigrants | Middle Africa | 0.3 /100 | #272 | Tragic 12.7% |
| Immigrants | Micronesia | 0.3 /100 | #273 | Tragic 12.7% |
| Bermudans | 0.3 /100 | #274 | Tragic 12.7% |
| Central American Indians | 0.3 /100 | #275 | Tragic 12.7% |