Iroquois vs Latvian Single Father Poverty
COMPARE
Iroquois
Latvian
Single Father Poverty
Single Father Poverty Comparison
Iroquois
Latvians
17.7%
SINGLE FATHER POVERTY
0.0/ 100
METRIC RATING
279th/ 347
METRIC RANK
16.5%
SINGLE FATHER POVERTY
28.9/ 100
METRIC RATING
189th/ 347
METRIC RANK
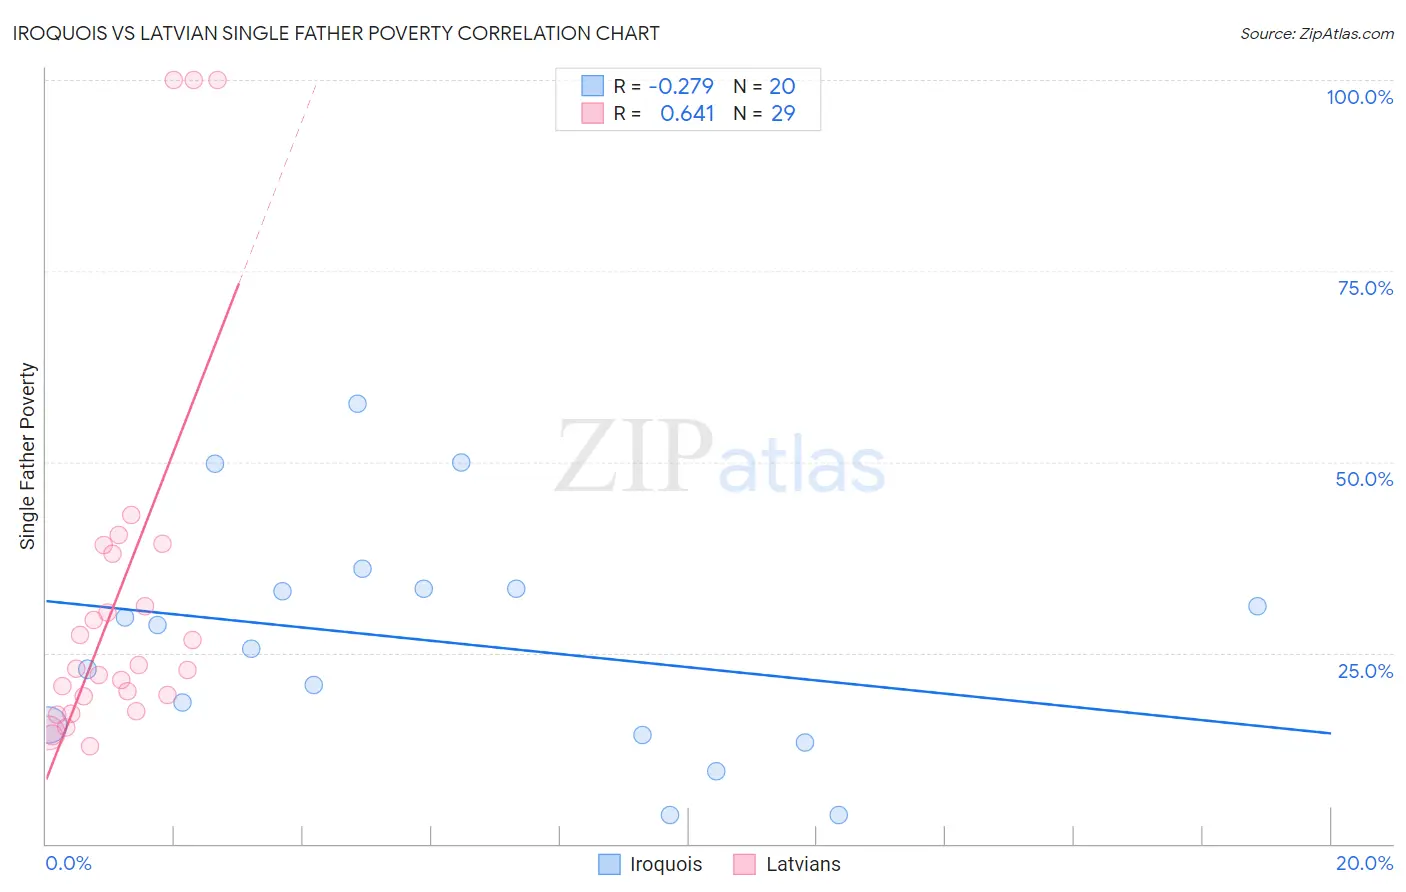
Iroquois vs Latvian Single Father Poverty Correlation Chart
The statistical analysis conducted on geographies consisting of 177,877,486 people shows a weak negative correlation between the proportion of Iroquois and poverty level among single fathers in the United States with a correlation coefficient (R) of -0.279 and weighted average of 17.7%. Similarly, the statistical analysis conducted on geographies consisting of 180,631,509 people shows a significant positive correlation between the proportion of Latvians and poverty level among single fathers in the United States with a correlation coefficient (R) of 0.641 and weighted average of 16.5%, a difference of 7.8%.
Single Father Poverty Correlation Summary
| Measurement | Iroquois | Latvian |
| Minimum | 3.8% | 12.7% |
| Maximum | 57.7% | 100.0% |
| Range | 53.9% | 87.3% |
| Mean | 26.5% | 32.6% |
| Median | 27.1% | 22.9% |
| Interquartile 25% (IQ1) | 14.8% | 18.3% |
| Interquartile 75% (IQ3) | 33.3% | 38.6% |
| Interquartile Range (IQR) | 18.5% | 20.2% |
| Standard Deviation (Sample) | 14.9% | 24.8% |
| Standard Deviation (Population) | 14.5% | 24.4% |
Similar Demographics by Single Father Poverty
Demographics Similar to Iroquois by Single Father Poverty
In terms of single father poverty, the demographic groups most similar to Iroquois are Scottish (17.7%, a difference of 0.050%), German (17.7%, a difference of 0.15%), Lebanese (17.7%, a difference of 0.16%), German Russian (17.7%, a difference of 0.31%), and British West Indian (17.7%, a difference of 0.37%).
| Demographics | Rating | Rank | Single Father Poverty |
| Barbadians | 0.1 /100 | #272 | Tragic 17.5% |
| Italians | 0.1 /100 | #273 | Tragic 17.5% |
| Macedonians | 0.1 /100 | #274 | Tragic 17.7% |
| British West Indians | 0.0 /100 | #275 | Tragic 17.7% |
| German Russians | 0.0 /100 | #276 | Tragic 17.7% |
| Lebanese | 0.0 /100 | #277 | Tragic 17.7% |
| Germans | 0.0 /100 | #278 | Tragic 17.7% |
| Iroquois | 0.0 /100 | #279 | Tragic 17.7% |
| Scottish | 0.0 /100 | #280 | Tragic 17.7% |
| English | 0.0 /100 | #281 | Tragic 17.8% |
| Dutch | 0.0 /100 | #282 | Tragic 17.8% |
| Alsatians | 0.0 /100 | #283 | Tragic 17.8% |
| Welsh | 0.0 /100 | #284 | Tragic 17.8% |
| Immigrants | Lebanon | 0.0 /100 | #285 | Tragic 17.9% |
| Immigrants | North Macedonia | 0.0 /100 | #286 | Tragic 17.9% |
Demographics Similar to Latvians by Single Father Poverty
In terms of single father poverty, the demographic groups most similar to Latvians are Immigrants from Burma/Myanmar (16.5%, a difference of 0.050%), Russian (16.4%, a difference of 0.060%), Ukrainian (16.4%, a difference of 0.080%), Immigrants from Guyana (16.5%, a difference of 0.10%), and Immigrants from Venezuela (16.4%, a difference of 0.11%).
| Demographics | Rating | Rank | Single Father Poverty |
| Immigrants | Italy | 35.7 /100 | #182 | Fair 16.4% |
| Aleuts | 35.3 /100 | #183 | Fair 16.4% |
| Cambodians | 34.6 /100 | #184 | Fair 16.4% |
| Panamanians | 33.6 /100 | #185 | Fair 16.4% |
| Immigrants | Venezuela | 31.0 /100 | #186 | Fair 16.4% |
| Ukrainians | 30.4 /100 | #187 | Fair 16.4% |
| Russians | 30.1 /100 | #188 | Fair 16.4% |
| Latvians | 28.9 /100 | #189 | Fair 16.5% |
| Immigrants | Burma/Myanmar | 28.0 /100 | #190 | Fair 16.5% |
| Immigrants | Guyana | 27.1 /100 | #191 | Fair 16.5% |
| Immigrants | Switzerland | 24.8 /100 | #192 | Fair 16.5% |
| Ecuadorians | 24.5 /100 | #193 | Fair 16.5% |
| Cape Verdeans | 24.4 /100 | #194 | Fair 16.5% |
| Immigrants | Barbados | 24.3 /100 | #195 | Fair 16.5% |
| Immigrants | Canada | 21.9 /100 | #196 | Fair 16.5% |