Iroquois vs Immigrants from Caribbean Divorced or Separated
COMPARE
Iroquois
Immigrants from Caribbean
Divorced or Separated
Divorced or Separated Comparison
Iroquois
Immigrants from Caribbean
12.9%
DIVORCED OR SEPARATED
0.0/ 100
METRIC RATING
289th/ 347
METRIC RANK
13.6%
DIVORCED OR SEPARATED
0.0/ 100
METRIC RATING
328th/ 347
METRIC RANK
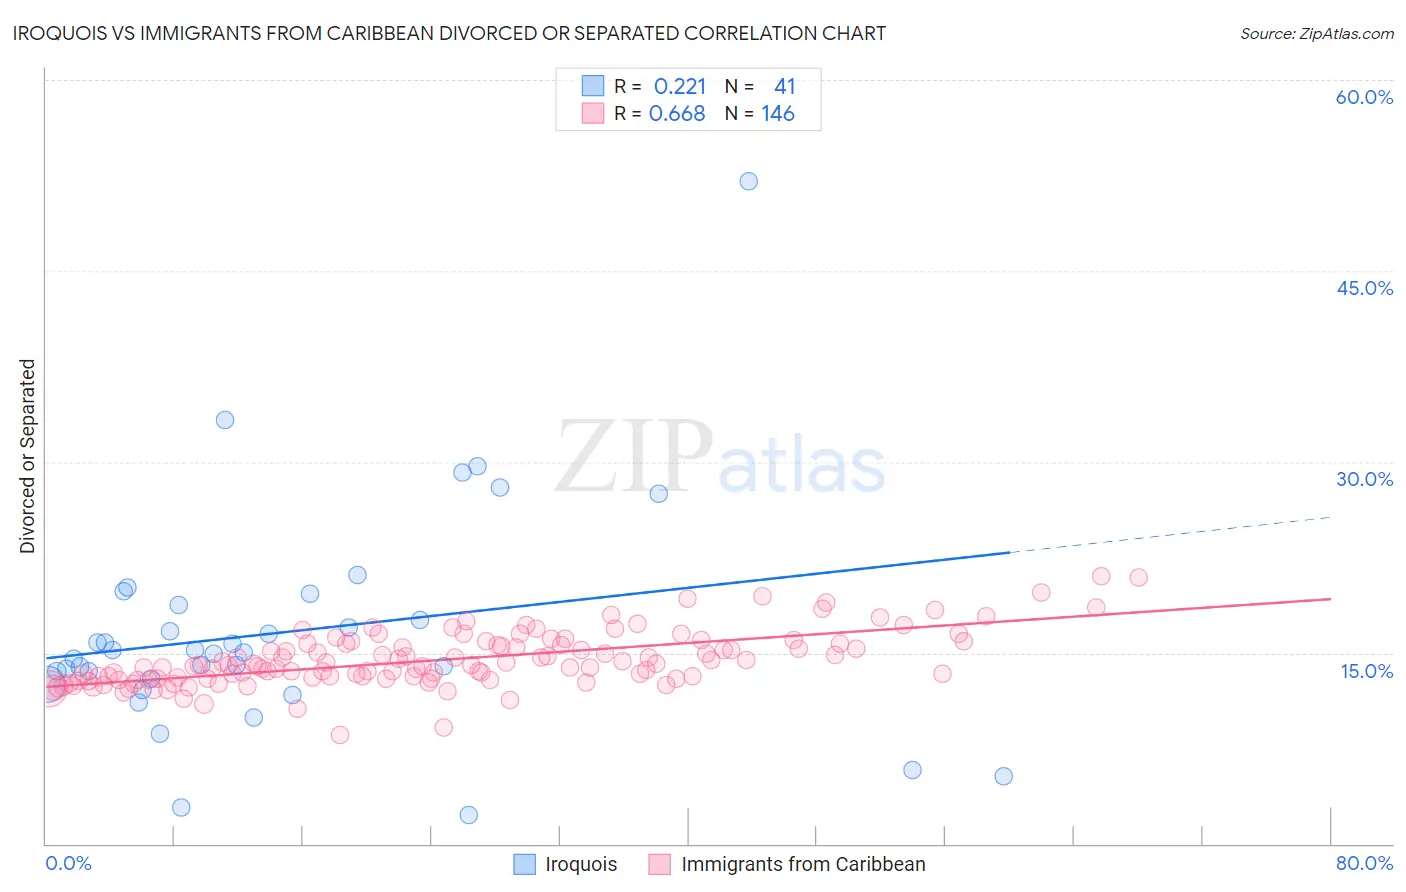
Iroquois vs Immigrants from Caribbean Divorced or Separated Correlation Chart
The statistical analysis conducted on geographies consisting of 207,262,032 people shows a weak positive correlation between the proportion of Iroquois and percentage of population currently divorced or separated in the United States with a correlation coefficient (R) of 0.221 and weighted average of 12.9%. Similarly, the statistical analysis conducted on geographies consisting of 449,832,030 people shows a significant positive correlation between the proportion of Immigrants from Caribbean and percentage of population currently divorced or separated in the United States with a correlation coefficient (R) of 0.668 and weighted average of 13.6%, a difference of 5.5%.
Divorced or Separated Correlation Summary
| Measurement | Iroquois | Immigrants from Caribbean |
| Minimum | 2.3% | 8.5% |
| Maximum | 52.0% | 21.0% |
| Range | 49.7% | 12.5% |
| Mean | 16.6% | 14.4% |
| Median | 15.0% | 14.0% |
| Interquartile 25% (IQ1) | 12.8% | 13.0% |
| Interquartile 75% (IQ3) | 19.2% | 15.7% |
| Interquartile Range (IQR) | 6.4% | 2.7% |
| Standard Deviation (Sample) | 8.8% | 2.1% |
| Standard Deviation (Population) | 8.7% | 2.1% |
Similar Demographics by Divorced or Separated
Demographics Similar to Iroquois by Divorced or Separated
In terms of divorced or separated, the demographic groups most similar to Iroquois are Pima (12.9%, a difference of 0.14%), French Canadian (12.8%, a difference of 0.15%), Immigrants from Honduras (12.9%, a difference of 0.26%), Scotch-Irish (12.9%, a difference of 0.32%), and Honduran (12.8%, a difference of 0.41%).
| Demographics | Rating | Rank | Divorced or Separated |
| Sub-Saharan Africans | 0.1 /100 | #282 | Tragic 12.7% |
| Delaware | 0.1 /100 | #283 | Tragic 12.7% |
| Immigrants | Nonimmigrants | 0.1 /100 | #284 | Tragic 12.8% |
| French | 0.1 /100 | #285 | Tragic 12.8% |
| Spanish | 0.1 /100 | #286 | Tragic 12.8% |
| Hondurans | 0.1 /100 | #287 | Tragic 12.8% |
| French Canadians | 0.1 /100 | #288 | Tragic 12.8% |
| Iroquois | 0.0 /100 | #289 | Tragic 12.9% |
| Pima | 0.0 /100 | #290 | Tragic 12.9% |
| Immigrants | Honduras | 0.0 /100 | #291 | Tragic 12.9% |
| Scotch-Irish | 0.0 /100 | #292 | Tragic 12.9% |
| Jamaicans | 0.0 /100 | #293 | Tragic 12.9% |
| Apache | 0.0 /100 | #294 | Tragic 12.9% |
| Celtics | 0.0 /100 | #295 | Tragic 13.0% |
| Nicaraguans | 0.0 /100 | #296 | Tragic 13.0% |
Demographics Similar to Immigrants from Caribbean by Divorced or Separated
In terms of divorced or separated, the demographic groups most similar to Immigrants from Caribbean are Houma (13.6%, a difference of 0.15%), Paiute (13.6%, a difference of 0.26%), Comanche (13.5%, a difference of 0.38%), Black/African American (13.6%, a difference of 0.39%), and Immigrants from Congo (13.5%, a difference of 0.86%).
| Demographics | Rating | Rank | Divorced or Separated |
| Cheyenne | 0.0 /100 | #321 | Tragic 13.4% |
| Immigrants | Haiti | 0.0 /100 | #322 | Tragic 13.4% |
| U.S. Virgin Islanders | 0.0 /100 | #323 | Tragic 13.4% |
| Osage | 0.0 /100 | #324 | Tragic 13.4% |
| Potawatomi | 0.0 /100 | #325 | Tragic 13.5% |
| Immigrants | Congo | 0.0 /100 | #326 | Tragic 13.5% |
| Comanche | 0.0 /100 | #327 | Tragic 13.5% |
| Immigrants | Caribbean | 0.0 /100 | #328 | Tragic 13.6% |
| Houma | 0.0 /100 | #329 | Tragic 13.6% |
| Paiute | 0.0 /100 | #330 | Tragic 13.6% |
| Blacks/African Americans | 0.0 /100 | #331 | Tragic 13.6% |
| Cherokee | 0.0 /100 | #332 | Tragic 13.7% |
| Puerto Ricans | 0.0 /100 | #333 | Tragic 13.9% |
| Immigrants | Bahamas | 0.0 /100 | #334 | Tragic 13.9% |
| Dutch West Indians | 0.0 /100 | #335 | Tragic 14.0% |