Iroquois vs Palestinian Divorced or Separated
COMPARE
Iroquois
Palestinian
Divorced or Separated
Divorced or Separated Comparison
Iroquois
Palestinians
12.9%
DIVORCED OR SEPARATED
0.0/ 100
METRIC RATING
289th/ 347
METRIC RANK
11.5%
DIVORCED OR SEPARATED
99.7/ 100
METRIC RATING
68th/ 347
METRIC RANK
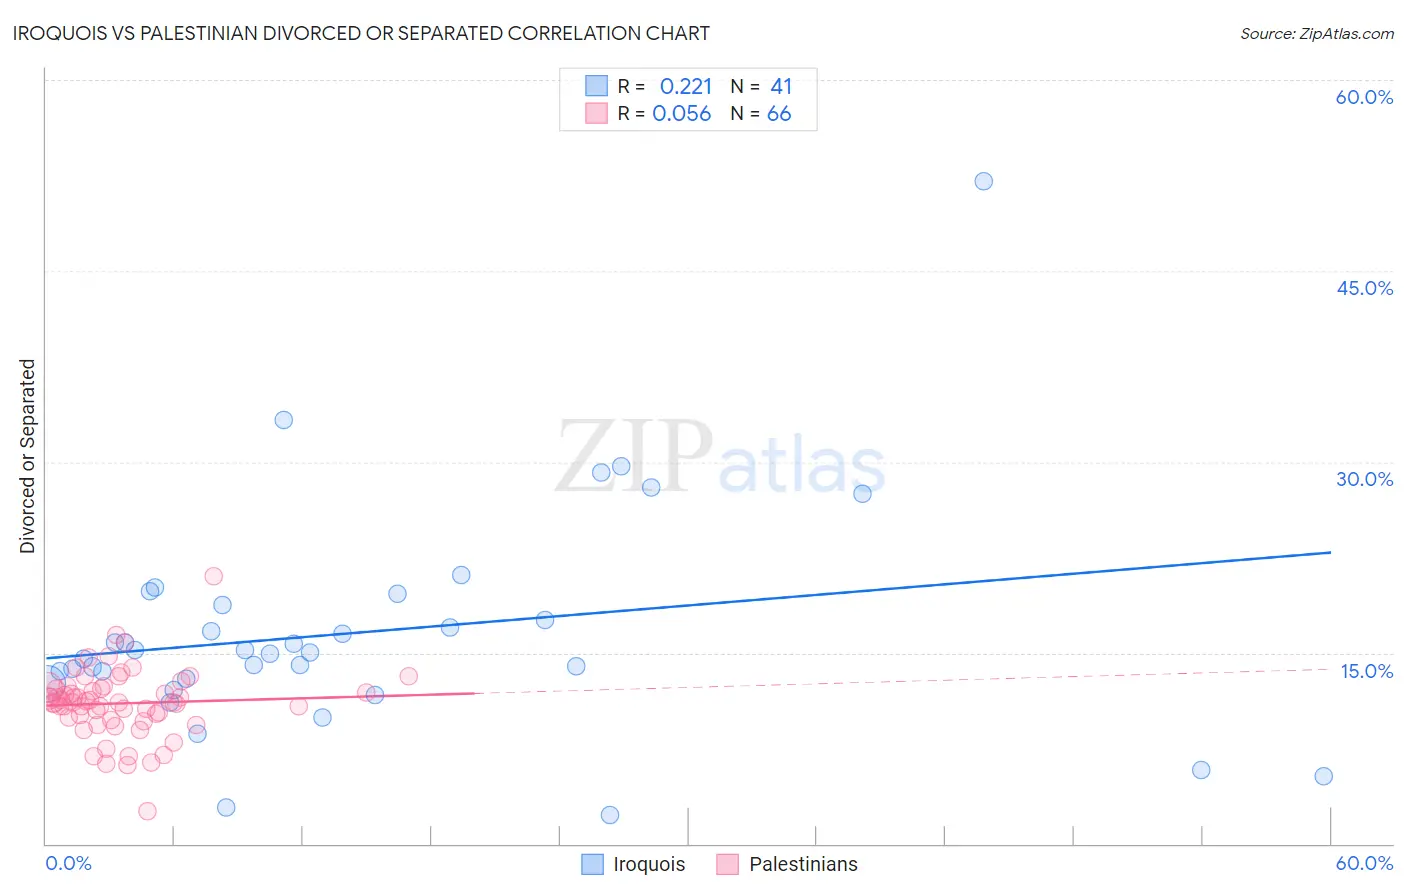
Iroquois vs Palestinian Divorced or Separated Correlation Chart
The statistical analysis conducted on geographies consisting of 207,262,032 people shows a weak positive correlation between the proportion of Iroquois and percentage of population currently divorced or separated in the United States with a correlation coefficient (R) of 0.221 and weighted average of 12.9%. Similarly, the statistical analysis conducted on geographies consisting of 216,394,525 people shows a slight positive correlation between the proportion of Palestinians and percentage of population currently divorced or separated in the United States with a correlation coefficient (R) of 0.056 and weighted average of 11.5%, a difference of 12.3%.
Divorced or Separated Correlation Summary
| Measurement | Iroquois | Palestinian |
| Minimum | 2.3% | 2.6% |
| Maximum | 52.0% | 21.0% |
| Range | 49.7% | 18.4% |
| Mean | 16.6% | 11.0% |
| Median | 15.0% | 11.1% |
| Interquartile 25% (IQ1) | 12.8% | 9.9% |
| Interquartile 75% (IQ3) | 19.2% | 12.2% |
| Interquartile Range (IQR) | 6.4% | 2.3% |
| Standard Deviation (Sample) | 8.8% | 2.7% |
| Standard Deviation (Population) | 8.7% | 2.7% |
Similar Demographics by Divorced or Separated
Demographics Similar to Iroquois by Divorced or Separated
In terms of divorced or separated, the demographic groups most similar to Iroquois are Pima (12.9%, a difference of 0.14%), French Canadian (12.8%, a difference of 0.15%), Immigrants from Honduras (12.9%, a difference of 0.26%), Scotch-Irish (12.9%, a difference of 0.32%), and Honduran (12.8%, a difference of 0.41%).
| Demographics | Rating | Rank | Divorced or Separated |
| Sub-Saharan Africans | 0.1 /100 | #282 | Tragic 12.7% |
| Delaware | 0.1 /100 | #283 | Tragic 12.7% |
| Immigrants | Nonimmigrants | 0.1 /100 | #284 | Tragic 12.8% |
| French | 0.1 /100 | #285 | Tragic 12.8% |
| Spanish | 0.1 /100 | #286 | Tragic 12.8% |
| Hondurans | 0.1 /100 | #287 | Tragic 12.8% |
| French Canadians | 0.1 /100 | #288 | Tragic 12.8% |
| Iroquois | 0.0 /100 | #289 | Tragic 12.9% |
| Pima | 0.0 /100 | #290 | Tragic 12.9% |
| Immigrants | Honduras | 0.0 /100 | #291 | Tragic 12.9% |
| Scotch-Irish | 0.0 /100 | #292 | Tragic 12.9% |
| Jamaicans | 0.0 /100 | #293 | Tragic 12.9% |
| Apache | 0.0 /100 | #294 | Tragic 12.9% |
| Celtics | 0.0 /100 | #295 | Tragic 13.0% |
| Nicaraguans | 0.0 /100 | #296 | Tragic 13.0% |
Demographics Similar to Palestinians by Divorced or Separated
In terms of divorced or separated, the demographic groups most similar to Palestinians are Immigrants from Belgium (11.5%, a difference of 0.0%), Immigrants from Eastern Europe (11.5%, a difference of 0.020%), Immigrants from Syria (11.4%, a difference of 0.11%), Paraguayan (11.5%, a difference of 0.12%), and Jordanian (11.5%, a difference of 0.18%).
| Demographics | Rating | Rank | Divorced or Separated |
| Koreans | 99.9 /100 | #61 | Exceptional 11.3% |
| Luxembourgers | 99.9 /100 | #62 | Exceptional 11.3% |
| Immigrants | Kuwait | 99.9 /100 | #63 | Exceptional 11.3% |
| Macedonians | 99.8 /100 | #64 | Exceptional 11.4% |
| Immigrants | South Eastern Asia | 99.8 /100 | #65 | Exceptional 11.4% |
| Inupiat | 99.8 /100 | #66 | Exceptional 11.4% |
| Immigrants | Syria | 99.7 /100 | #67 | Exceptional 11.4% |
| Palestinians | 99.7 /100 | #68 | Exceptional 11.5% |
| Immigrants | Belgium | 99.7 /100 | #69 | Exceptional 11.5% |
| Immigrants | Eastern Europe | 99.7 /100 | #70 | Exceptional 11.5% |
| Paraguayans | 99.7 /100 | #71 | Exceptional 11.5% |
| Jordanians | 99.6 /100 | #72 | Exceptional 11.5% |
| Immigrants | North Macedonia | 99.6 /100 | #73 | Exceptional 11.5% |
| Taiwanese | 99.6 /100 | #74 | Exceptional 11.5% |
| Immigrants | Northern Africa | 99.6 /100 | #75 | Exceptional 11.5% |