Iroquois vs Immigrants from Romania Divorced or Separated
COMPARE
Iroquois
Immigrants from Romania
Divorced or Separated
Divorced or Separated Comparison
Iroquois
Immigrants from Romania
12.9%
DIVORCED OR SEPARATED
0.0/ 100
METRIC RATING
289th/ 347
METRIC RANK
11.5%
DIVORCED OR SEPARATED
99.3/ 100
METRIC RATING
82nd/ 347
METRIC RANK
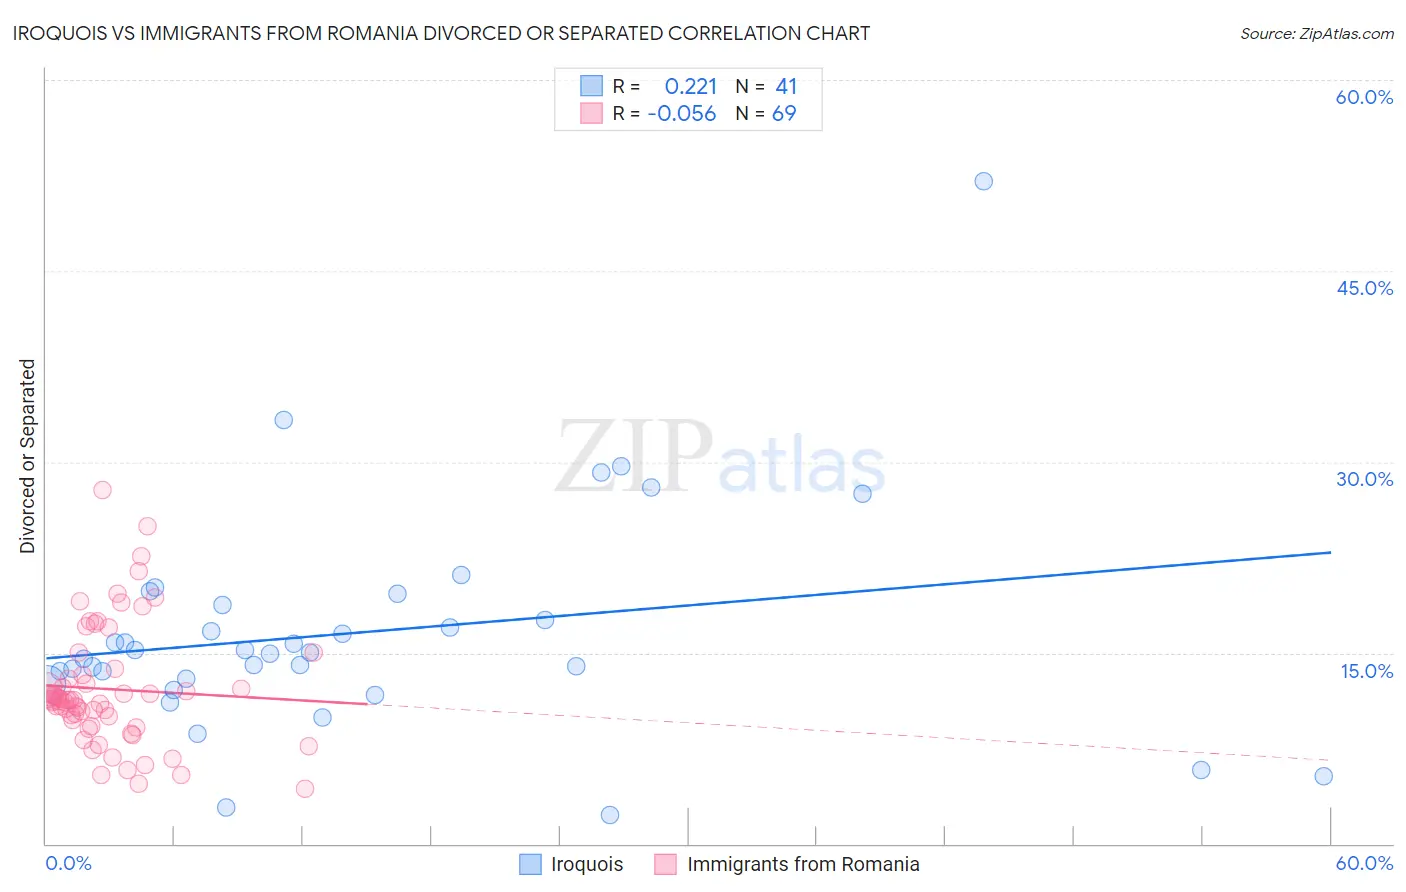
Iroquois vs Immigrants from Romania Divorced or Separated Correlation Chart
The statistical analysis conducted on geographies consisting of 207,262,032 people shows a weak positive correlation between the proportion of Iroquois and percentage of population currently divorced or separated in the United States with a correlation coefficient (R) of 0.221 and weighted average of 12.9%. Similarly, the statistical analysis conducted on geographies consisting of 256,993,939 people shows a slight negative correlation between the proportion of Immigrants from Romania and percentage of population currently divorced or separated in the United States with a correlation coefficient (R) of -0.056 and weighted average of 11.5%, a difference of 11.6%.
Divorced or Separated Correlation Summary
| Measurement | Iroquois | Immigrants from Romania |
| Minimum | 2.3% | 4.3% |
| Maximum | 52.0% | 27.8% |
| Range | 49.7% | 23.5% |
| Mean | 16.6% | 12.2% |
| Median | 15.0% | 11.3% |
| Interquartile 25% (IQ1) | 12.8% | 9.5% |
| Interquartile 75% (IQ3) | 19.2% | 13.5% |
| Interquartile Range (IQR) | 6.4% | 4.0% |
| Standard Deviation (Sample) | 8.8% | 4.7% |
| Standard Deviation (Population) | 8.7% | 4.7% |
Similar Demographics by Divorced or Separated
Demographics Similar to Iroquois by Divorced or Separated
In terms of divorced or separated, the demographic groups most similar to Iroquois are Pima (12.9%, a difference of 0.14%), French Canadian (12.8%, a difference of 0.15%), Immigrants from Honduras (12.9%, a difference of 0.26%), Scotch-Irish (12.9%, a difference of 0.32%), and Honduran (12.8%, a difference of 0.41%).
| Demographics | Rating | Rank | Divorced or Separated |
| Sub-Saharan Africans | 0.1 /100 | #282 | Tragic 12.7% |
| Delaware | 0.1 /100 | #283 | Tragic 12.7% |
| Immigrants | Nonimmigrants | 0.1 /100 | #284 | Tragic 12.8% |
| French | 0.1 /100 | #285 | Tragic 12.8% |
| Spanish | 0.1 /100 | #286 | Tragic 12.8% |
| Hondurans | 0.1 /100 | #287 | Tragic 12.8% |
| French Canadians | 0.1 /100 | #288 | Tragic 12.8% |
| Iroquois | 0.0 /100 | #289 | Tragic 12.9% |
| Pima | 0.0 /100 | #290 | Tragic 12.9% |
| Immigrants | Honduras | 0.0 /100 | #291 | Tragic 12.9% |
| Scotch-Irish | 0.0 /100 | #292 | Tragic 12.9% |
| Jamaicans | 0.0 /100 | #293 | Tragic 12.9% |
| Apache | 0.0 /100 | #294 | Tragic 12.9% |
| Celtics | 0.0 /100 | #295 | Tragic 13.0% |
| Nicaraguans | 0.0 /100 | #296 | Tragic 13.0% |
Demographics Similar to Immigrants from Romania by Divorced or Separated
In terms of divorced or separated, the demographic groups most similar to Immigrants from Romania are Immigrants from Bulgaria (11.5%, a difference of 0.030%), Bulgarian (11.5%, a difference of 0.050%), Russian (11.5%, a difference of 0.080%), Immigrants from Switzerland (11.5%, a difference of 0.090%), and Guyanese (11.5%, a difference of 0.11%).
| Demographics | Rating | Rank | Divorced or Separated |
| Immigrants | Northern Africa | 99.6 /100 | #75 | Exceptional 11.5% |
| Albanians | 99.6 /100 | #76 | Exceptional 11.5% |
| Immigrants | Italy | 99.5 /100 | #77 | Exceptional 11.5% |
| Afghans | 99.4 /100 | #78 | Exceptional 11.5% |
| Guyanese | 99.4 /100 | #79 | Exceptional 11.5% |
| Immigrants | Switzerland | 99.4 /100 | #80 | Exceptional 11.5% |
| Russians | 99.4 /100 | #81 | Exceptional 11.5% |
| Immigrants | Romania | 99.3 /100 | #82 | Exceptional 11.5% |
| Immigrants | Bulgaria | 99.3 /100 | #83 | Exceptional 11.5% |
| Bulgarians | 99.3 /100 | #84 | Exceptional 11.5% |
| Immigrants | Albania | 99.3 /100 | #85 | Exceptional 11.5% |
| Immigrants | Latvia | 99.2 /100 | #86 | Exceptional 11.6% |
| Immigrants | Nepal | 99.2 /100 | #87 | Exceptional 11.6% |
| Immigrants | Europe | 99.2 /100 | #88 | Exceptional 11.6% |
| Immigrants | Southern Europe | 99.1 /100 | #89 | Exceptional 11.6% |