Iroquois vs Immigrants from Netherlands Divorced or Separated
COMPARE
Iroquois
Immigrants from Netherlands
Divorced or Separated
Divorced or Separated Comparison
Iroquois
Immigrants from Netherlands
12.9%
DIVORCED OR SEPARATED
0.0/ 100
METRIC RATING
289th/ 347
METRIC RANK
11.9%
DIVORCED OR SEPARATED
83.9/ 100
METRIC RATING
138th/ 347
METRIC RANK
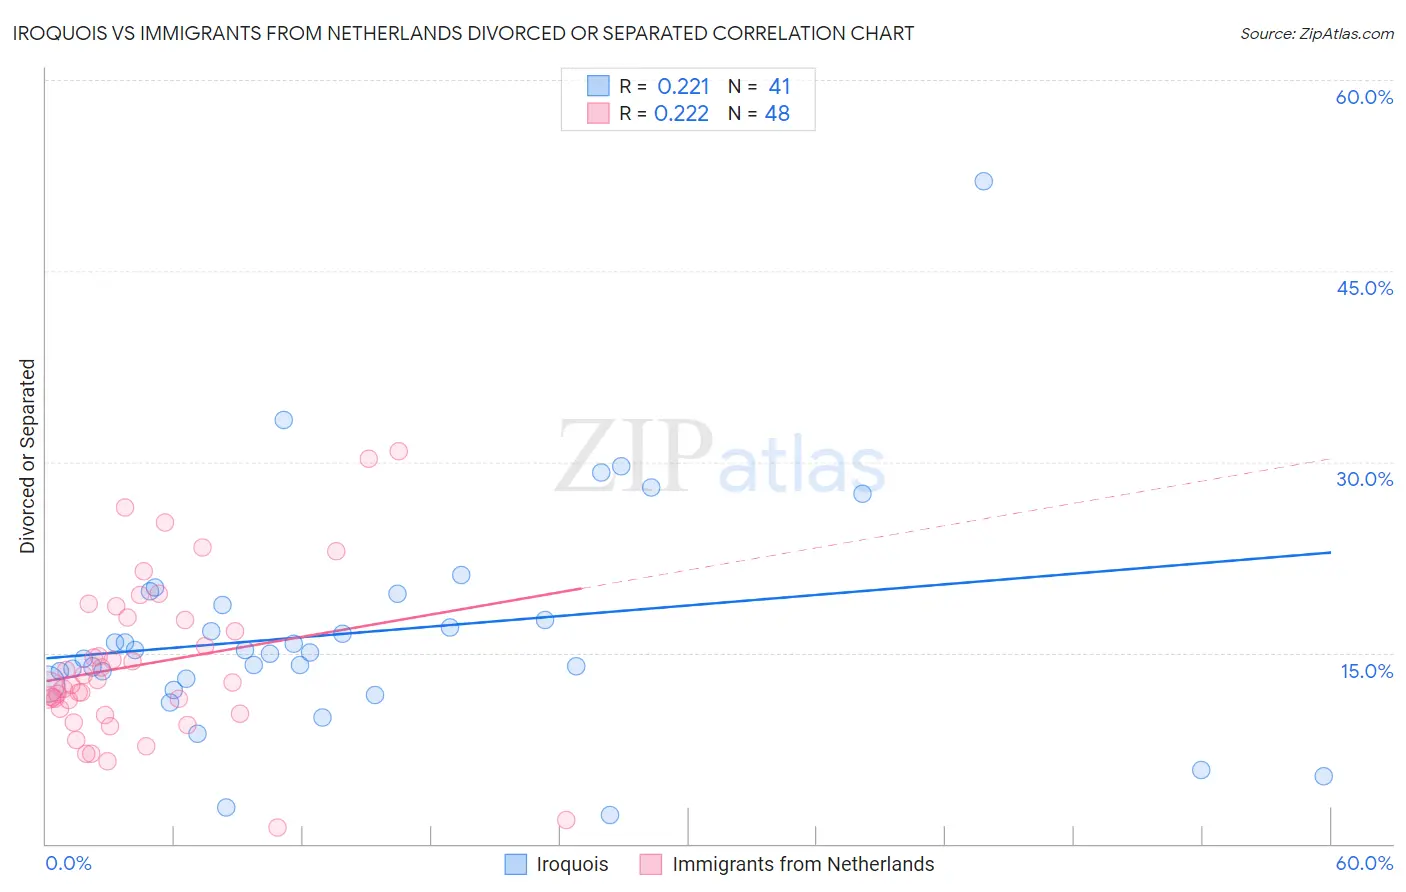
Iroquois vs Immigrants from Netherlands Divorced or Separated Correlation Chart
The statistical analysis conducted on geographies consisting of 207,262,032 people shows a weak positive correlation between the proportion of Iroquois and percentage of population currently divorced or separated in the United States with a correlation coefficient (R) of 0.221 and weighted average of 12.9%. Similarly, the statistical analysis conducted on geographies consisting of 237,821,691 people shows a weak positive correlation between the proportion of Immigrants from Netherlands and percentage of population currently divorced or separated in the United States with a correlation coefficient (R) of 0.222 and weighted average of 11.9%, a difference of 8.2%.
Divorced or Separated Correlation Summary
| Measurement | Iroquois | Immigrants from Netherlands |
| Minimum | 2.3% | 1.3% |
| Maximum | 52.0% | 30.8% |
| Range | 49.7% | 29.5% |
| Mean | 16.6% | 14.1% |
| Median | 15.0% | 12.6% |
| Interquartile 25% (IQ1) | 12.8% | 10.4% |
| Interquartile 75% (IQ3) | 19.2% | 17.7% |
| Interquartile Range (IQR) | 6.4% | 7.3% |
| Standard Deviation (Sample) | 8.8% | 6.3% |
| Standard Deviation (Population) | 8.7% | 6.3% |
Similar Demographics by Divorced or Separated
Demographics Similar to Iroquois by Divorced or Separated
In terms of divorced or separated, the demographic groups most similar to Iroquois are Pima (12.9%, a difference of 0.14%), French Canadian (12.8%, a difference of 0.15%), Immigrants from Honduras (12.9%, a difference of 0.26%), Scotch-Irish (12.9%, a difference of 0.32%), and Honduran (12.8%, a difference of 0.41%).
| Demographics | Rating | Rank | Divorced or Separated |
| Sub-Saharan Africans | 0.1 /100 | #282 | Tragic 12.7% |
| Delaware | 0.1 /100 | #283 | Tragic 12.7% |
| Immigrants | Nonimmigrants | 0.1 /100 | #284 | Tragic 12.8% |
| French | 0.1 /100 | #285 | Tragic 12.8% |
| Spanish | 0.1 /100 | #286 | Tragic 12.8% |
| Hondurans | 0.1 /100 | #287 | Tragic 12.8% |
| French Canadians | 0.1 /100 | #288 | Tragic 12.8% |
| Iroquois | 0.0 /100 | #289 | Tragic 12.9% |
| Pima | 0.0 /100 | #290 | Tragic 12.9% |
| Immigrants | Honduras | 0.0 /100 | #291 | Tragic 12.9% |
| Scotch-Irish | 0.0 /100 | #292 | Tragic 12.9% |
| Jamaicans | 0.0 /100 | #293 | Tragic 12.9% |
| Apache | 0.0 /100 | #294 | Tragic 12.9% |
| Celtics | 0.0 /100 | #295 | Tragic 13.0% |
| Nicaraguans | 0.0 /100 | #296 | Tragic 13.0% |
Demographics Similar to Immigrants from Netherlands by Divorced or Separated
In terms of divorced or separated, the demographic groups most similar to Immigrants from Netherlands are Alsatian (11.9%, a difference of 0.0%), Australian (11.9%, a difference of 0.020%), Lebanese (11.9%, a difference of 0.030%), Danish (11.9%, a difference of 0.060%), and Carpatho Rusyn (11.9%, a difference of 0.060%).
| Demographics | Rating | Rank | Divorced or Separated |
| Immigrants | Cambodia | 88.2 /100 | #131 | Excellent 11.8% |
| Immigrants | Afghanistan | 87.9 /100 | #132 | Excellent 11.8% |
| New Zealanders | 87.5 /100 | #133 | Excellent 11.9% |
| Argentineans | 85.1 /100 | #134 | Excellent 11.9% |
| Danes | 84.8 /100 | #135 | Excellent 11.9% |
| Carpatho Rusyns | 84.8 /100 | #136 | Excellent 11.9% |
| Alsatians | 84.0 /100 | #137 | Excellent 11.9% |
| Immigrants | Netherlands | 83.9 /100 | #138 | Excellent 11.9% |
| Australians | 83.6 /100 | #139 | Excellent 11.9% |
| Lebanese | 83.4 /100 | #140 | Excellent 11.9% |
| Immigrants | Morocco | 82.9 /100 | #141 | Excellent 11.9% |
| Immigrants | Zimbabwe | 81.5 /100 | #142 | Excellent 11.9% |
| Pakistanis | 81.3 /100 | #143 | Excellent 11.9% |
| Peruvians | 80.9 /100 | #144 | Excellent 11.9% |
| Croatians | 80.6 /100 | #145 | Excellent 11.9% |