Immigrants from Western Europe vs Fijian Divorced or Separated
COMPARE
Immigrants from Western Europe
Fijian
Divorced or Separated
Divorced or Separated Comparison
Immigrants from Western Europe
Fijians
12.1%
DIVORCED OR SEPARATED
45.6/ 100
METRIC RATING
179th/ 347
METRIC RANK
12.6%
DIVORCED OR SEPARATED
0.4/ 100
METRIC RATING
268th/ 347
METRIC RANK
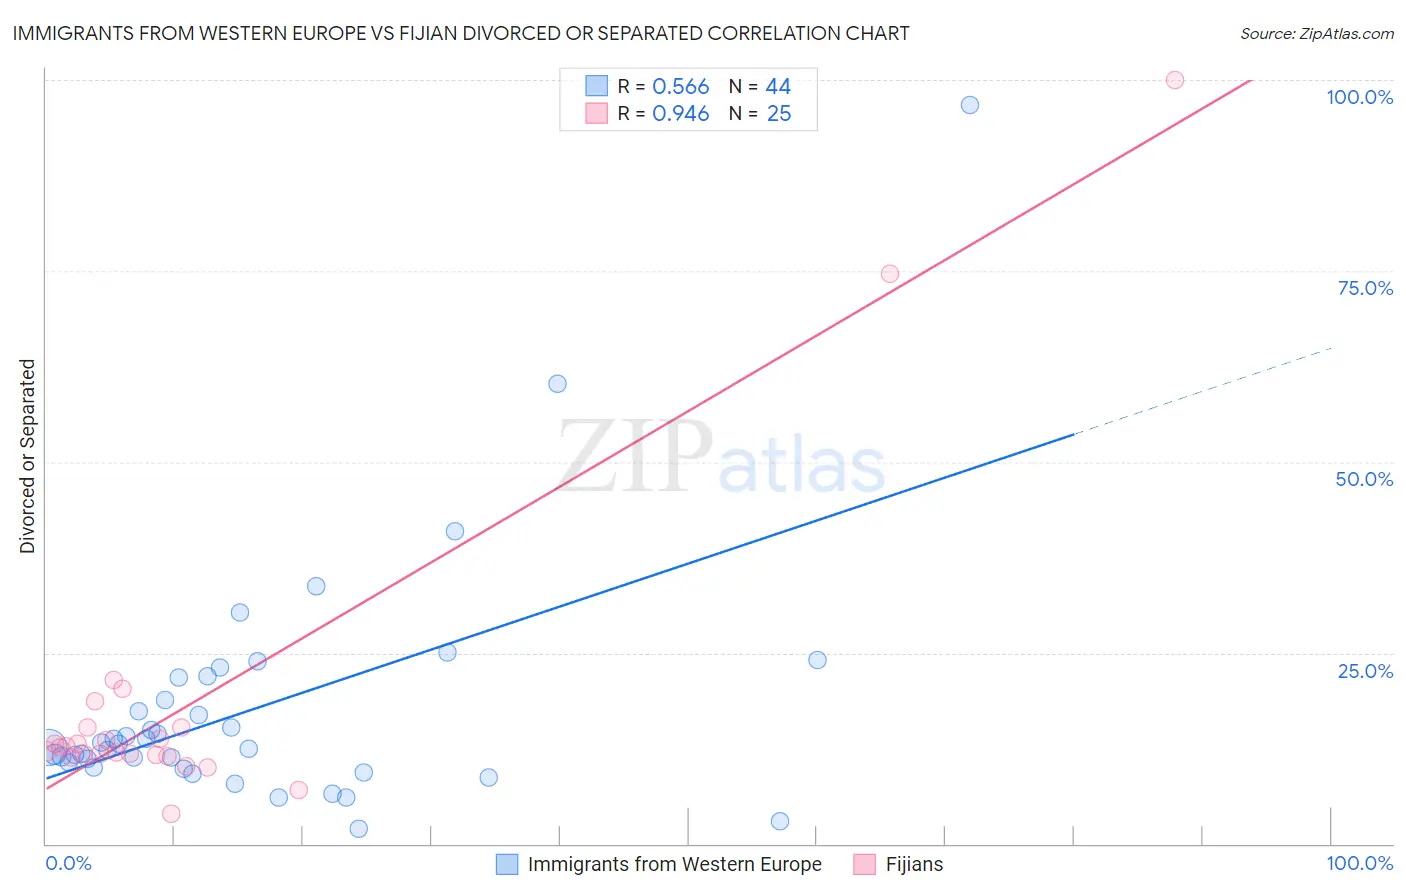
Immigrants from Western Europe vs Fijian Divorced or Separated Correlation Chart
The statistical analysis conducted on geographies consisting of 493,891,815 people shows a substantial positive correlation between the proportion of Immigrants from Western Europe and percentage of population currently divorced or separated in the United States with a correlation coefficient (R) of 0.566 and weighted average of 12.1%. Similarly, the statistical analysis conducted on geographies consisting of 55,948,408 people shows a near-perfect positive correlation between the proportion of Fijians and percentage of population currently divorced or separated in the United States with a correlation coefficient (R) of 0.946 and weighted average of 12.6%, a difference of 4.6%.
Divorced or Separated Correlation Summary
| Measurement | Immigrants from Western Europe | Fijian |
| Minimum | 1.9% | 4.0% |
| Maximum | 96.8% | 100.0% |
| Range | 94.9% | 96.0% |
| Mean | 17.6% | 18.8% |
| Median | 12.9% | 12.6% |
| Interquartile 25% (IQ1) | 10.3% | 11.6% |
| Interquartile 75% (IQ3) | 20.3% | 15.3% |
| Interquartile Range (IQR) | 9.9% | 3.7% |
| Standard Deviation (Sample) | 16.0% | 21.3% |
| Standard Deviation (Population) | 15.8% | 20.8% |
Similar Demographics by Divorced or Separated
Demographics Similar to Immigrants from Western Europe by Divorced or Separated
In terms of divorced or separated, the demographic groups most similar to Immigrants from Western Europe are Ghanaian (12.1%, a difference of 0.010%), Barbadian (12.1%, a difference of 0.020%), Immigrants from Canada (12.1%, a difference of 0.050%), Brazilian (12.1%, a difference of 0.080%), and Immigrants from Ethiopia (12.1%, a difference of 0.090%).
| Demographics | Rating | Rank | Divorced or Separated |
| Immigrants | Mexico | 53.2 /100 | #172 | Average 12.0% |
| Immigrants | Moldova | 50.4 /100 | #173 | Average 12.1% |
| Hawaiians | 50.0 /100 | #174 | Average 12.1% |
| Immigrants | Sierra Leone | 50.0 /100 | #175 | Average 12.1% |
| Pennsylvania Germans | 48.9 /100 | #176 | Average 12.1% |
| Brazilians | 47.7 /100 | #177 | Average 12.1% |
| Ghanaians | 45.9 /100 | #178 | Average 12.1% |
| Immigrants | Western Europe | 45.6 /100 | #179 | Average 12.1% |
| Barbadians | 45.0 /100 | #180 | Average 12.1% |
| Immigrants | Canada | 44.0 /100 | #181 | Average 12.1% |
| Immigrants | Ethiopia | 43.1 /100 | #182 | Average 12.1% |
| Immigrants | Central America | 42.9 /100 | #183 | Average 12.1% |
| Immigrants | North America | 41.1 /100 | #184 | Average 12.1% |
| Immigrants | Nigeria | 40.5 /100 | #185 | Average 12.1% |
| Immigrants | Chile | 39.0 /100 | #186 | Fair 12.1% |
Demographics Similar to Fijians by Divorced or Separated
In terms of divorced or separated, the demographic groups most similar to Fijians are Scottish (12.6%, a difference of 0.010%), Immigrants from Liberia (12.6%, a difference of 0.010%), White/Caucasian (12.6%, a difference of 0.060%), Immigrants from Senegal (12.6%, a difference of 0.070%), and English (12.6%, a difference of 0.080%).
| Demographics | Rating | Rank | Divorced or Separated |
| Immigrants | Dominica | 0.5 /100 | #261 | Tragic 12.6% |
| Basques | 0.5 /100 | #262 | Tragic 12.6% |
| Immigrants | Panama | 0.5 /100 | #263 | Tragic 12.6% |
| English | 0.5 /100 | #264 | Tragic 12.6% |
| Immigrants | Senegal | 0.5 /100 | #265 | Tragic 12.6% |
| Whites/Caucasians | 0.5 /100 | #266 | Tragic 12.6% |
| Scottish | 0.4 /100 | #267 | Tragic 12.6% |
| Fijians | 0.4 /100 | #268 | Tragic 12.6% |
| Immigrants | Liberia | 0.4 /100 | #269 | Tragic 12.6% |
| Ute | 0.4 /100 | #270 | Tragic 12.6% |
| Panamanians | 0.3 /100 | #271 | Tragic 12.7% |
| Immigrants | Middle Africa | 0.3 /100 | #272 | Tragic 12.7% |
| Immigrants | Micronesia | 0.3 /100 | #273 | Tragic 12.7% |
| Bermudans | 0.3 /100 | #274 | Tragic 12.7% |
| Central American Indians | 0.3 /100 | #275 | Tragic 12.7% |