Finnish vs Fijian Divorced or Separated
COMPARE
Finnish
Fijian
Divorced or Separated
Divorced or Separated Comparison
Finns
Fijians
12.5%
DIVORCED OR SEPARATED
1.8/ 100
METRIC RATING
249th/ 347
METRIC RANK
12.6%
DIVORCED OR SEPARATED
0.4/ 100
METRIC RATING
268th/ 347
METRIC RANK
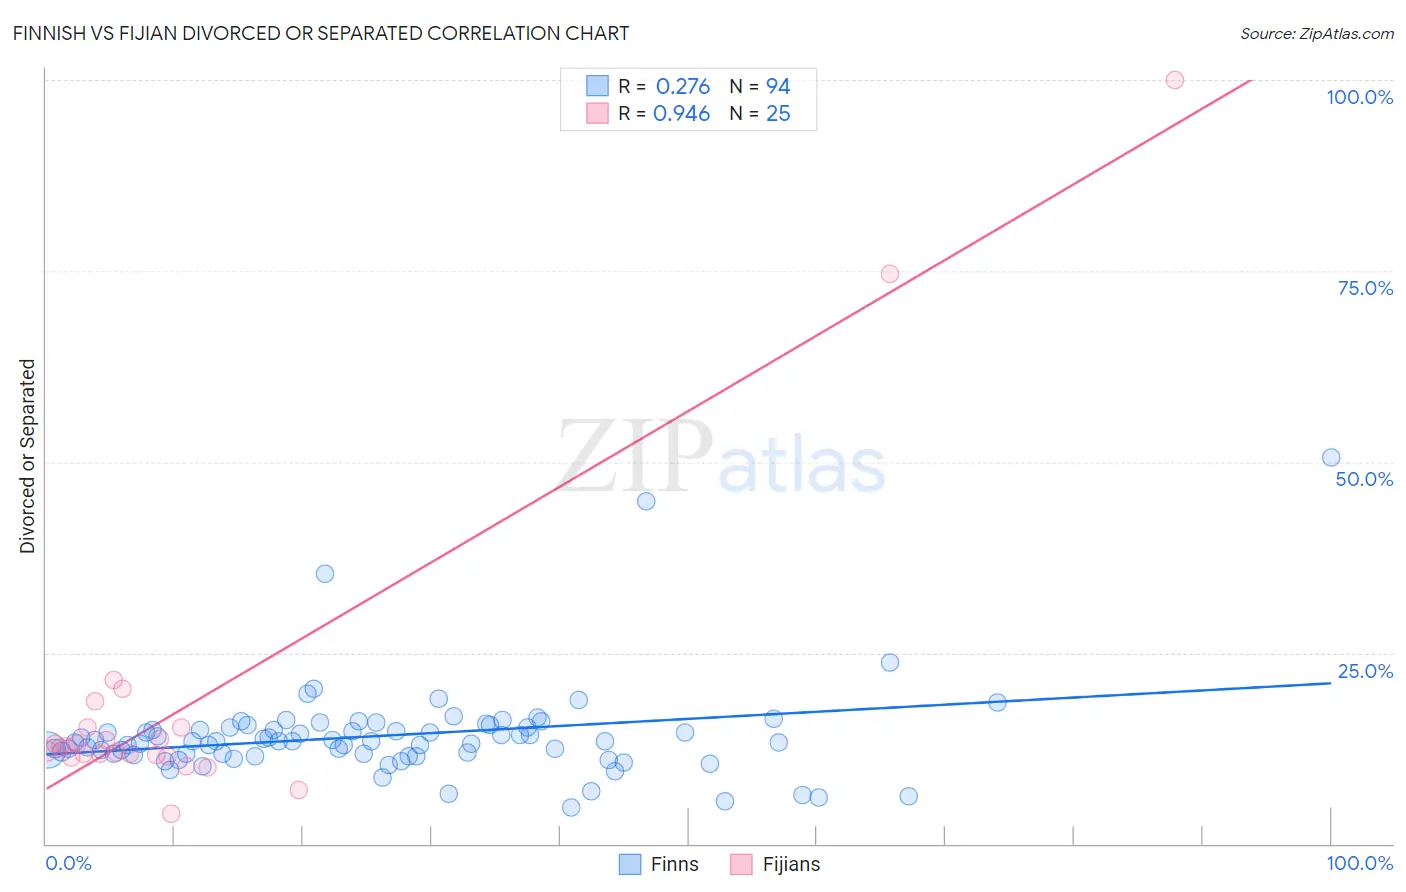
Finnish vs Fijian Divorced or Separated Correlation Chart
The statistical analysis conducted on geographies consisting of 404,587,172 people shows a weak positive correlation between the proportion of Finns and percentage of population currently divorced or separated in the United States with a correlation coefficient (R) of 0.276 and weighted average of 12.5%. Similarly, the statistical analysis conducted on geographies consisting of 55,948,408 people shows a near-perfect positive correlation between the proportion of Fijians and percentage of population currently divorced or separated in the United States with a correlation coefficient (R) of 0.946 and weighted average of 12.6%, a difference of 1.2%.
Divorced or Separated Correlation Summary
| Measurement | Finnish | Fijian |
| Minimum | 4.8% | 4.0% |
| Maximum | 50.5% | 100.0% |
| Range | 45.7% | 96.0% |
| Mean | 14.1% | 18.8% |
| Median | 13.4% | 12.6% |
| Interquartile 25% (IQ1) | 11.7% | 11.6% |
| Interquartile 75% (IQ3) | 15.2% | 15.3% |
| Interquartile Range (IQR) | 3.5% | 3.7% |
| Standard Deviation (Sample) | 6.3% | 21.3% |
| Standard Deviation (Population) | 6.3% | 20.8% |
Demographics Similar to Finns and Fijians by Divorced or Separated
In terms of divorced or separated, the demographic groups most similar to Finns are Nepalese (12.5%, a difference of 0.010%), Irish (12.5%, a difference of 0.27%), Aleut (12.5%, a difference of 0.28%), Liberian (12.6%, a difference of 0.60%), and Somali (12.6%, a difference of 0.61%). Similarly, the demographic groups most similar to Fijians are Scottish (12.6%, a difference of 0.010%), White/Caucasian (12.6%, a difference of 0.060%), Immigrants from Senegal (12.6%, a difference of 0.070%), English (12.6%, a difference of 0.080%), and Immigrants from Panama (12.6%, a difference of 0.10%).
| Demographics | Rating | Rank | Divorced or Separated |
| Nepalese | 1.8 /100 | #248 | Tragic 12.5% |
| Finns | 1.8 /100 | #249 | Tragic 12.5% |
| Irish | 1.3 /100 | #250 | Tragic 12.5% |
| Aleuts | 1.3 /100 | #251 | Tragic 12.5% |
| Liberians | 0.9 /100 | #252 | Tragic 12.6% |
| Somalis | 0.9 /100 | #253 | Tragic 12.6% |
| Senegalese | 0.8 /100 | #254 | Tragic 12.6% |
| Welsh | 0.7 /100 | #255 | Tragic 12.6% |
| Immigrants | Colombia | 0.6 /100 | #256 | Tragic 12.6% |
| Immigrants | Somalia | 0.6 /100 | #257 | Tragic 12.6% |
| Indonesians | 0.6 /100 | #258 | Tragic 12.6% |
| Yuman | 0.6 /100 | #259 | Tragic 12.6% |
| Immigrants | Uruguay | 0.6 /100 | #260 | Tragic 12.6% |
| Immigrants | Dominica | 0.5 /100 | #261 | Tragic 12.6% |
| Basques | 0.5 /100 | #262 | Tragic 12.6% |
| Immigrants | Panama | 0.5 /100 | #263 | Tragic 12.6% |
| English | 0.5 /100 | #264 | Tragic 12.6% |
| Immigrants | Senegal | 0.5 /100 | #265 | Tragic 12.6% |
| Whites/Caucasians | 0.5 /100 | #266 | Tragic 12.6% |
| Scottish | 0.4 /100 | #267 | Tragic 12.6% |
| Fijians | 0.4 /100 | #268 | Tragic 12.6% |