Iroquois vs Fijian Disability Age 18 to 34
COMPARE
Iroquois
Fijian
Disability Age 18 to 34
Disability Age 18 to 34 Comparison
Iroquois
Fijians
7.9%
DISABILITY AGE 18 TO 34
0.0/ 100
METRIC RATING
313th/ 347
METRIC RANK
7.2%
DISABILITY AGE 18 TO 34
0.6/ 100
METRIC RATING
250th/ 347
METRIC RANK
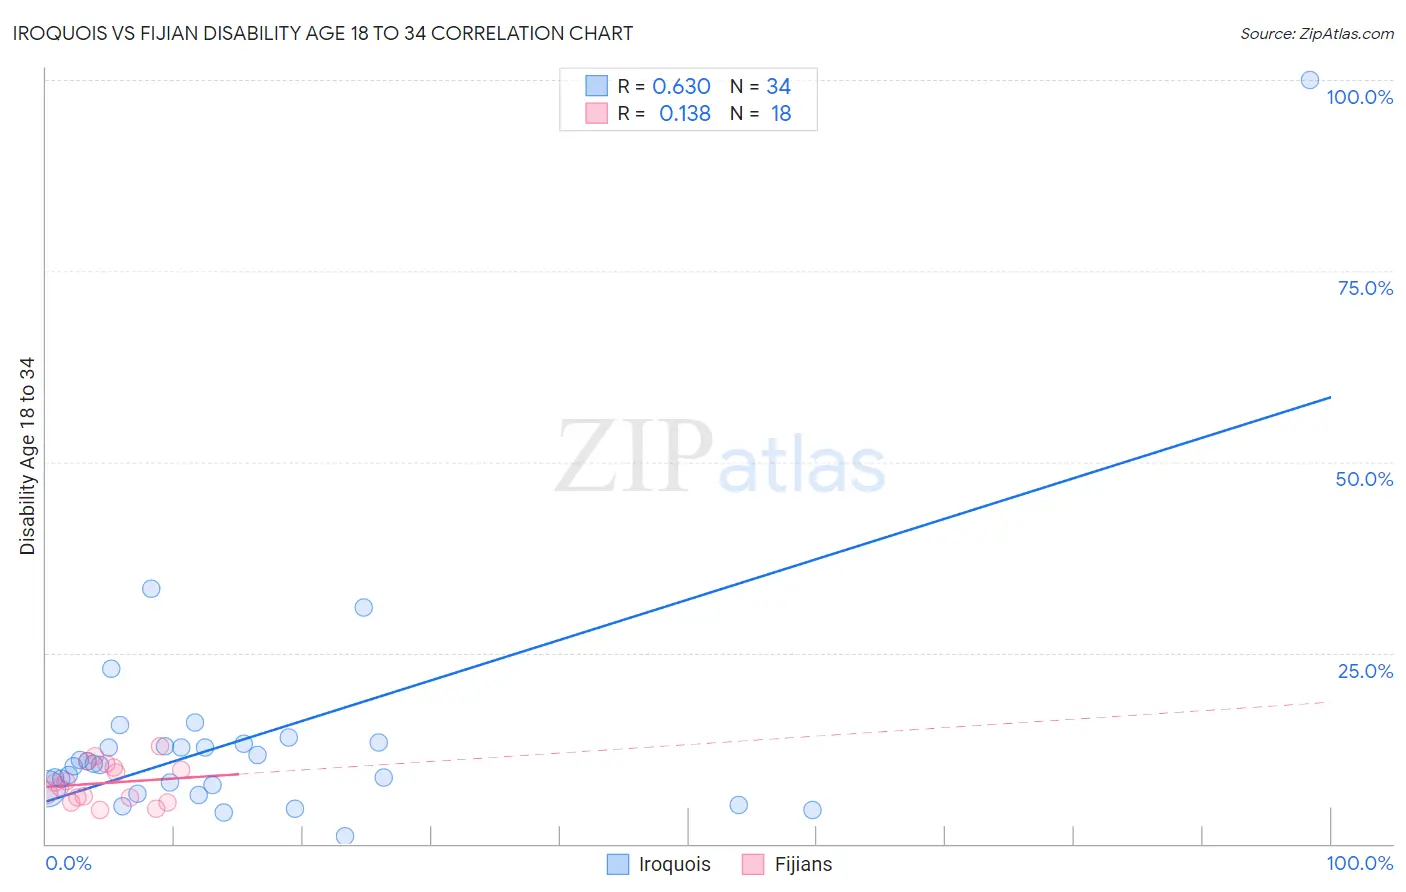
Iroquois vs Fijian Disability Age 18 to 34 Correlation Chart
The statistical analysis conducted on geographies consisting of 207,019,096 people shows a significant positive correlation between the proportion of Iroquois and percentage of population with a disability between the ages 18 and 35 in the United States with a correlation coefficient (R) of 0.630 and weighted average of 7.9%. Similarly, the statistical analysis conducted on geographies consisting of 55,913,538 people shows a poor positive correlation between the proportion of Fijians and percentage of population with a disability between the ages 18 and 35 in the United States with a correlation coefficient (R) of 0.138 and weighted average of 7.2%, a difference of 10.0%.
Disability Age 18 to 34 Correlation Summary
| Measurement | Iroquois | Fijian |
| Minimum | 0.98% | 4.3% |
| Maximum | 100.0% | 12.8% |
| Range | 99.0% | 8.5% |
| Mean | 13.8% | 7.9% |
| Median | 10.4% | 7.7% |
| Interquartile 25% (IQ1) | 7.2% | 6.0% |
| Interquartile 75% (IQ3) | 13.0% | 10.0% |
| Interquartile Range (IQR) | 5.8% | 4.0% |
| Standard Deviation (Sample) | 16.7% | 2.5% |
| Standard Deviation (Population) | 16.4% | 2.5% |
Similar Demographics by Disability Age 18 to 34
Demographics Similar to Iroquois by Disability Age 18 to 34
In terms of disability age 18 to 34, the demographic groups most similar to Iroquois are Spanish American (7.9%, a difference of 0.040%), French (7.9%, a difference of 0.40%), Colville (7.9%, a difference of 0.44%), Finnish (7.8%, a difference of 1.1%), and American (8.0%, a difference of 1.2%).
| Demographics | Rating | Rank | Disability Age 18 to 34 |
| English | 0.0 /100 | #306 | Tragic 7.8% |
| Scotch-Irish | 0.0 /100 | #307 | Tragic 7.8% |
| Pennsylvania Germans | 0.0 /100 | #308 | Tragic 7.8% |
| Alaska Natives | 0.0 /100 | #309 | Tragic 7.8% |
| Finns | 0.0 /100 | #310 | Tragic 7.8% |
| French | 0.0 /100 | #311 | Tragic 7.9% |
| Spanish Americans | 0.0 /100 | #312 | Tragic 7.9% |
| Iroquois | 0.0 /100 | #313 | Tragic 7.9% |
| Colville | 0.0 /100 | #314 | Tragic 7.9% |
| Americans | 0.0 /100 | #315 | Tragic 8.0% |
| Puerto Ricans | 0.0 /100 | #316 | Tragic 8.0% |
| Hmong | 0.0 /100 | #317 | Tragic 8.1% |
| French Canadians | 0.0 /100 | #318 | Tragic 8.1% |
| Aleuts | 0.0 /100 | #319 | Tragic 8.1% |
| Navajo | 0.0 /100 | #320 | Tragic 8.1% |
Demographics Similar to Fijians by Disability Age 18 to 34
In terms of disability age 18 to 34, the demographic groups most similar to Fijians are Spaniard (7.2%, a difference of 0.010%), Polish (7.2%, a difference of 0.030%), Malaysian (7.2%, a difference of 0.29%), Croatian (7.2%, a difference of 0.30%), and Guamanian/Chamorro (7.2%, a difference of 0.39%).
| Demographics | Rating | Rank | Disability Age 18 to 34 |
| Icelanders | 1.0 /100 | #243 | Tragic 7.1% |
| Immigrants | Zaire | 0.9 /100 | #244 | Tragic 7.1% |
| Hungarians | 0.9 /100 | #245 | Tragic 7.1% |
| Immigrants | Liberia | 0.8 /100 | #246 | Tragic 7.1% |
| Yugoslavians | 0.8 /100 | #247 | Tragic 7.2% |
| Guamanians/Chamorros | 0.8 /100 | #248 | Tragic 7.2% |
| Malaysians | 0.7 /100 | #249 | Tragic 7.2% |
| Fijians | 0.6 /100 | #250 | Tragic 7.2% |
| Spaniards | 0.6 /100 | #251 | Tragic 7.2% |
| Poles | 0.6 /100 | #252 | Tragic 7.2% |
| Croatians | 0.5 /100 | #253 | Tragic 7.2% |
| Indonesians | 0.4 /100 | #254 | Tragic 7.2% |
| Immigrants | Germany | 0.4 /100 | #255 | Tragic 7.2% |
| Immigrants | Laos | 0.4 /100 | #256 | Tragic 7.2% |
| Czechs | 0.3 /100 | #257 | Tragic 7.2% |