Iranian vs Immigrants from Switzerland Currently Married
COMPARE
Iranian
Immigrants from Switzerland
Currently Married
Currently Married Comparison
Iranians
Immigrants from Switzerland
48.6%
CURRENTLY MARRIED
99.0/ 100
METRIC RATING
50th/ 347
METRIC RANK
46.9%
CURRENTLY MARRIED
67.8/ 100
METRIC RATING
157th/ 347
METRIC RANK
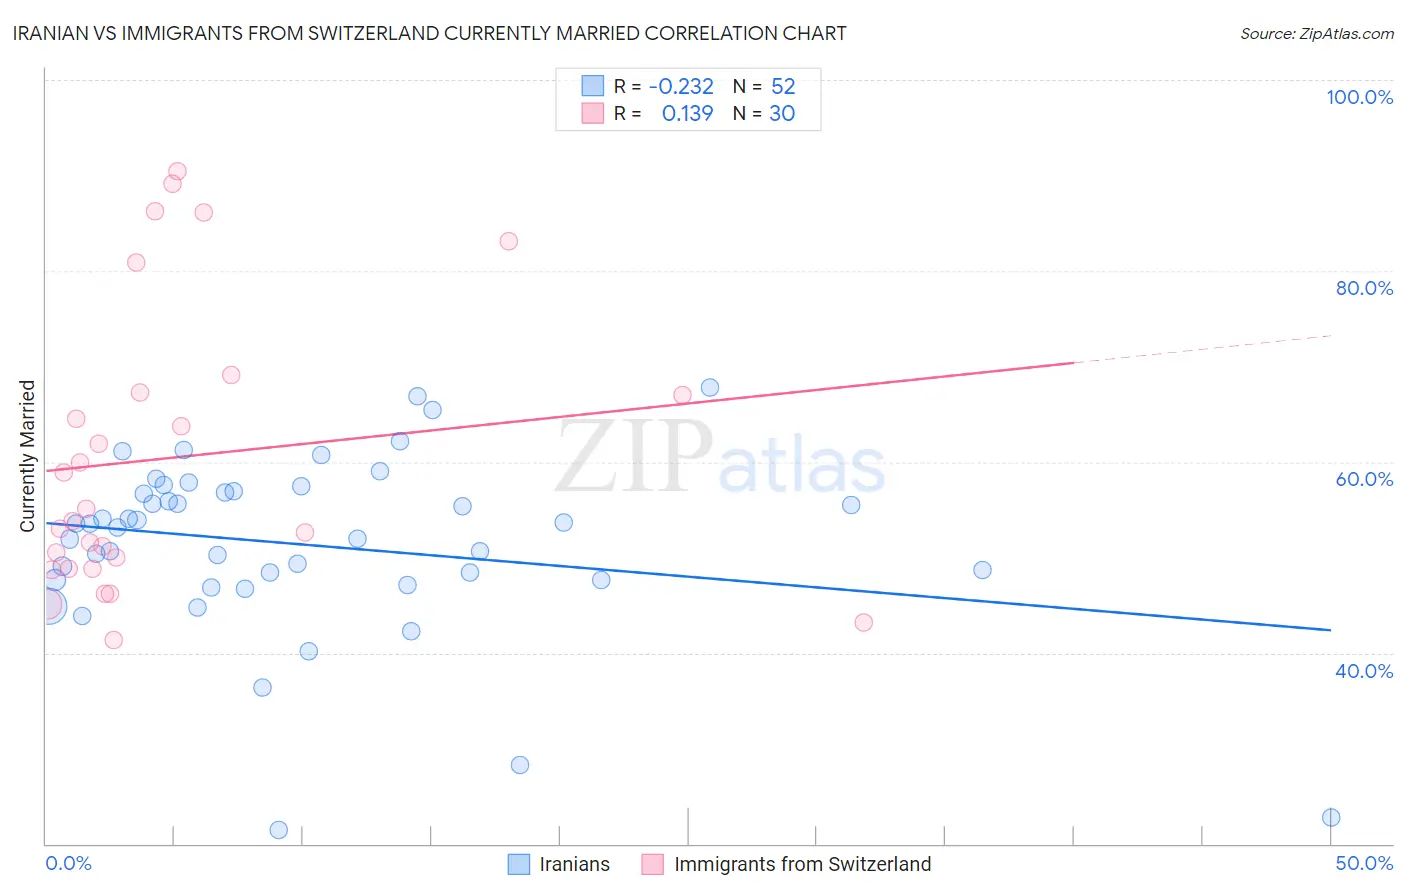
Iranian vs Immigrants from Switzerland Currently Married Correlation Chart
The statistical analysis conducted on geographies consisting of 316,855,418 people shows a weak negative correlation between the proportion of Iranians and percentage of population currently married in the United States with a correlation coefficient (R) of -0.232 and weighted average of 48.6%. Similarly, the statistical analysis conducted on geographies consisting of 148,074,779 people shows a poor positive correlation between the proportion of Immigrants from Switzerland and percentage of population currently married in the United States with a correlation coefficient (R) of 0.139 and weighted average of 46.9%, a difference of 3.5%.
Currently Married Correlation Summary
| Measurement | Iranian | Immigrants from Switzerland |
| Minimum | 21.4% | 41.3% |
| Maximum | 67.8% | 90.4% |
| Range | 46.4% | 49.1% |
| Mean | 51.3% | 60.5% |
| Median | 53.3% | 54.4% |
| Interquartile 25% (IQ1) | 47.6% | 48.8% |
| Interquartile 75% (IQ3) | 56.9% | 67.3% |
| Interquartile Range (IQR) | 9.3% | 18.5% |
| Standard Deviation (Sample) | 9.4% | 14.9% |
| Standard Deviation (Population) | 9.3% | 14.7% |
Similar Demographics by Currently Married
Demographics Similar to Iranians by Currently Married
In terms of currently married, the demographic groups most similar to Iranians are White/Caucasian (48.6%, a difference of 0.010%), Bhutanese (48.6%, a difference of 0.060%), Russian (48.6%, a difference of 0.090%), Austrian (48.7%, a difference of 0.19%), and Immigrants from Iran (48.7%, a difference of 0.21%).
| Demographics | Rating | Rank | Currently Married |
| Scotch-Irish | 99.3 /100 | #43 | Exceptional 48.7% |
| Immigrants | North America | 99.3 /100 | #44 | Exceptional 48.7% |
| Belgians | 99.3 /100 | #45 | Exceptional 48.7% |
| Immigrants | Iran | 99.2 /100 | #46 | Exceptional 48.7% |
| Northern Europeans | 99.2 /100 | #47 | Exceptional 48.7% |
| Austrians | 99.2 /100 | #48 | Exceptional 48.7% |
| Bhutanese | 99.1 /100 | #49 | Exceptional 48.6% |
| Iranians | 99.0 /100 | #50 | Exceptional 48.6% |
| Whites/Caucasians | 99.0 /100 | #51 | Exceptional 48.6% |
| Russians | 98.9 /100 | #52 | Exceptional 48.6% |
| Immigrants | Austria | 98.8 /100 | #53 | Exceptional 48.5% |
| Immigrants | Moldova | 98.7 /100 | #54 | Exceptional 48.5% |
| Immigrants | North Macedonia | 98.7 /100 | #55 | Exceptional 48.5% |
| Latvians | 98.7 /100 | #56 | Exceptional 48.5% |
| Immigrants | Netherlands | 98.6 /100 | #57 | Exceptional 48.5% |
Demographics Similar to Immigrants from Switzerland by Currently Married
In terms of currently married, the demographic groups most similar to Immigrants from Switzerland are Spanish (47.0%, a difference of 0.010%), Immigrants from Venezuela (47.0%, a difference of 0.030%), Albanian (47.0%, a difference of 0.030%), Arab (47.0%, a difference of 0.030%), and Immigrants from Serbia (47.0%, a difference of 0.040%).
| Demographics | Rating | Rank | Currently Married |
| Immigrants | Turkey | 70.0 /100 | #150 | Good 47.0% |
| Chileans | 69.8 /100 | #151 | Good 47.0% |
| Immigrants | Serbia | 68.8 /100 | #152 | Good 47.0% |
| Immigrants | Venezuela | 68.6 /100 | #153 | Good 47.0% |
| Albanians | 68.6 /100 | #154 | Good 47.0% |
| Arabs | 68.6 /100 | #155 | Good 47.0% |
| Spanish | 68.1 /100 | #156 | Good 47.0% |
| Immigrants | Switzerland | 67.8 /100 | #157 | Good 46.9% |
| Cherokee | 66.8 /100 | #158 | Good 46.9% |
| Iraqis | 66.4 /100 | #159 | Good 46.9% |
| Immigrants | Uzbekistan | 66.0 /100 | #160 | Good 46.9% |
| Immigrants | Southern Europe | 65.9 /100 | #161 | Good 46.9% |
| Immigrants | Nonimmigrants | 65.4 /100 | #162 | Good 46.9% |
| Delaware | 64.7 /100 | #163 | Good 46.9% |
| Immigrants | Western Asia | 64.2 /100 | #164 | Good 46.9% |