Iranian vs Immigrants from Dominica Currently Married
COMPARE
Iranian
Immigrants from Dominica
Currently Married
Currently Married Comparison
Iranians
Immigrants from Dominica
48.6%
CURRENTLY MARRIED
99.0/ 100
METRIC RATING
50th/ 347
METRIC RANK
40.3%
CURRENTLY MARRIED
0.0/ 100
METRIC RATING
330th/ 347
METRIC RANK
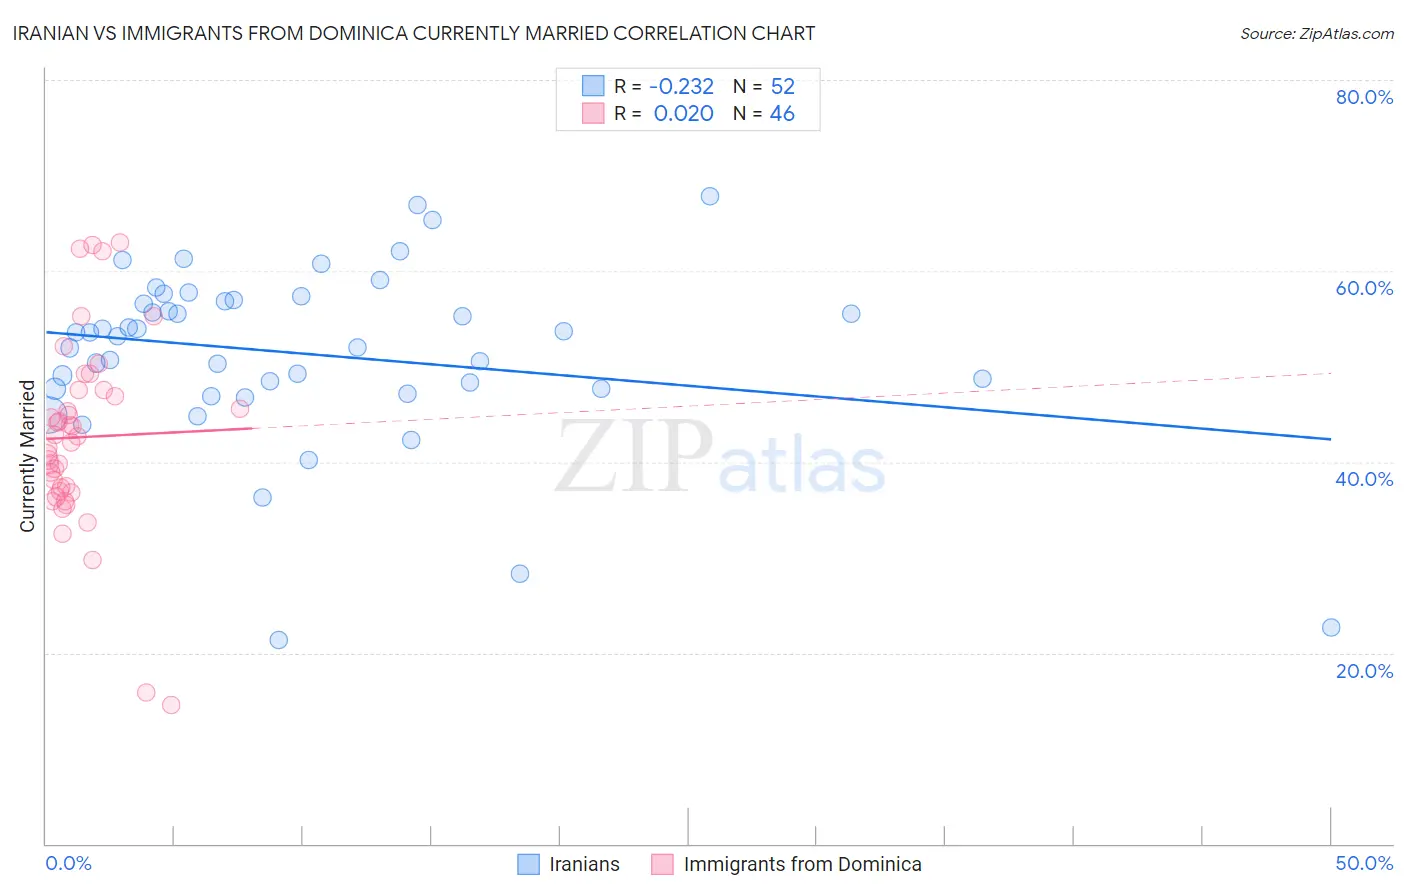
Iranian vs Immigrants from Dominica Currently Married Correlation Chart
The statistical analysis conducted on geographies consisting of 316,855,418 people shows a weak negative correlation between the proportion of Iranians and percentage of population currently married in the United States with a correlation coefficient (R) of -0.232 and weighted average of 48.6%. Similarly, the statistical analysis conducted on geographies consisting of 83,796,433 people shows no correlation between the proportion of Immigrants from Dominica and percentage of population currently married in the United States with a correlation coefficient (R) of 0.020 and weighted average of 40.3%, a difference of 20.5%.
Currently Married Correlation Summary
| Measurement | Iranian | Immigrants from Dominica |
| Minimum | 21.4% | 14.5% |
| Maximum | 67.8% | 63.0% |
| Range | 46.4% | 48.5% |
| Mean | 51.3% | 42.6% |
| Median | 53.3% | 42.4% |
| Interquartile 25% (IQ1) | 47.6% | 36.9% |
| Interquartile 75% (IQ3) | 56.9% | 47.5% |
| Interquartile Range (IQR) | 9.3% | 10.6% |
| Standard Deviation (Sample) | 9.4% | 10.0% |
| Standard Deviation (Population) | 9.3% | 9.9% |
Similar Demographics by Currently Married
Demographics Similar to Iranians by Currently Married
In terms of currently married, the demographic groups most similar to Iranians are White/Caucasian (48.6%, a difference of 0.010%), Bhutanese (48.6%, a difference of 0.060%), Russian (48.6%, a difference of 0.090%), Austrian (48.7%, a difference of 0.19%), and Immigrants from Iran (48.7%, a difference of 0.21%).
| Demographics | Rating | Rank | Currently Married |
| Scotch-Irish | 99.3 /100 | #43 | Exceptional 48.7% |
| Immigrants | North America | 99.3 /100 | #44 | Exceptional 48.7% |
| Belgians | 99.3 /100 | #45 | Exceptional 48.7% |
| Immigrants | Iran | 99.2 /100 | #46 | Exceptional 48.7% |
| Northern Europeans | 99.2 /100 | #47 | Exceptional 48.7% |
| Austrians | 99.2 /100 | #48 | Exceptional 48.7% |
| Bhutanese | 99.1 /100 | #49 | Exceptional 48.6% |
| Iranians | 99.0 /100 | #50 | Exceptional 48.6% |
| Whites/Caucasians | 99.0 /100 | #51 | Exceptional 48.6% |
| Russians | 98.9 /100 | #52 | Exceptional 48.6% |
| Immigrants | Austria | 98.8 /100 | #53 | Exceptional 48.5% |
| Immigrants | Moldova | 98.7 /100 | #54 | Exceptional 48.5% |
| Immigrants | North Macedonia | 98.7 /100 | #55 | Exceptional 48.5% |
| Latvians | 98.7 /100 | #56 | Exceptional 48.5% |
| Immigrants | Netherlands | 98.6 /100 | #57 | Exceptional 48.5% |
Demographics Similar to Immigrants from Dominica by Currently Married
In terms of currently married, the demographic groups most similar to Immigrants from Dominica are Immigrants from Barbados (40.3%, a difference of 0.020%), Crow (40.4%, a difference of 0.090%), Arapaho (40.5%, a difference of 0.52%), Senegalese (40.6%, a difference of 0.56%), and Immigrants from St. Vincent and the Grenadines (40.1%, a difference of 0.69%).
| Demographics | Rating | Rank | Currently Married |
| Immigrants | West Indies | 0.0 /100 | #323 | Tragic 40.7% |
| Immigrants | Senegal | 0.0 /100 | #324 | Tragic 40.7% |
| U.S. Virgin Islanders | 0.0 /100 | #325 | Tragic 40.7% |
| Barbadians | 0.0 /100 | #326 | Tragic 40.6% |
| Senegalese | 0.0 /100 | #327 | Tragic 40.6% |
| Arapaho | 0.0 /100 | #328 | Tragic 40.5% |
| Crow | 0.0 /100 | #329 | Tragic 40.4% |
| Immigrants | Dominica | 0.0 /100 | #330 | Tragic 40.3% |
| Immigrants | Barbados | 0.0 /100 | #331 | Tragic 40.3% |
| Immigrants | St. Vincent and the Grenadines | 0.0 /100 | #332 | Tragic 40.1% |
| Yup'ik | 0.0 /100 | #333 | Tragic 39.9% |
| Puerto Ricans | 0.0 /100 | #334 | Tragic 39.9% |
| Lumbee | 0.0 /100 | #335 | Tragic 39.8% |
| British West Indians | 0.0 /100 | #336 | Tragic 39.8% |
| Blacks/African Americans | 0.0 /100 | #337 | Tragic 39.6% |