Iranian vs Immigrants from Zaire Householder Income Ages 25 - 44 years

COMPARE

Iranian
Race
Ancestry
AfghanAfricanAlaska NativeAlaskan AthabascanAlbanianAleutAlsatianAmericanApacheArabArapahoArgentineanArmenianAssyrian/Chaldean/SyriacAustralianAustrianBahamianBangladeshiBarbadianBasqueBelgianBelizeanBermudanBhutaneseBlackfeetBolivianBrazilianBritishBritish West IndianBulgarianBurmeseCajunCambodianCanadianCape VerdeanCarpatho RusynCelticCentral AmericanCentral American IndianCherokeeCheyenneChickasawChileanChineseChippewaChoctawColombianColvilleComancheCosta RicanCreeCreekCroatianCrowCubanCypriotCzechCzechoslovakianDanishDelawareDominicanDutchDutch West IndianEastern EuropeanEcuadorianEgyptianEnglishEstonianEthiopianEuropeanFijianFilipinoFinnishFrenchFrench American IndianFrench CanadianGermanGerman RussianGhanaianGreekGuamanian/ChamorroGuatemalanGuyaneseHaitianHmongHonduranHopiHoumaHungarianIcelanderIndian (Asian)IndonesianInupiatIranianIraqiIrishIroquoisIsraeliItalianJamaicanJapaneseJordanianKenyanKiowaKoreanLaotianLatvianLebaneseLiberianLithuanianLumbeeLuxembourgerMacedonianMalaysianMalteseMarshalleseMenomineeMexicanMexican American IndianMongolianMoroccanNative HawaiianNavajoNepaleseNew ZealanderNicaraguanNigerianNorthern EuropeanNorwegianOkinawanOsageOttawaPaiutePakistaniPalestinianPanamanianParaguayanPennsylvania GermanPeruvianPimaPolishPortuguesePotawatomiPuebloPuerto RicanPuget Sound SalishRomanianRussianSalvadoranSamoanScandinavianScotch-IrishScottishSeminoleSenegaleseSerbianShoshoneSierra LeoneanSiouxSlavicSlovakSloveneSomaliSouth AfricanSouth AmericanSouth American IndianSoviet UnionSpaniardSpanishSpanish AmericanSpanish American IndianSri LankanSubsaharan AfricanSudaneseSwedishSwissSyrianTaiwaneseThaiTlingit-HaidaTohono O'OdhamTonganTrinidadian and TobagonianTsimshianTurkishU.S. Virgin IslanderUgandanUkrainianUruguayanUteVenezuelanVietnameseWelshWest IndianYakamaYaquiYugoslavianYumanYup'ikZimbabwean
Immigration
NonimmigrantsImmigrantsAfghanistanAfricaAlbaniaArgentinaArmeniaAsiaAustraliaAustriaBahamasBangladeshBarbadosBelarusBelgiumBelizeBoliviaBosnia and HerzegovinaBrazilBulgariaBurma/MyanmarCabo VerdeCambodiaCameroonCanadaCaribbeanCentral AmericaChileChinaColombiaCongoCosta RicaCroatiaCubaCzechoslovakiaDenmarkDominicaDominican RepublicEastern AfricaEastern AsiaEastern EuropeEcuadorEgyptEl SalvadorEnglandEritreaEthiopiaEuropeFijiFranceGermanyGhanaGreeceGrenadaGuatemalaGuyanaHaitiHondurasHong KongHungaryIndiaIndonesiaIranIraqIrelandIsraelItalyJamaicaJapanJordanKazakhstanKenyaKoreaKuwaitLaosLatin AmericaLatviaLebanonLiberiaLithuaniaMalaysiaMexicoMicronesiaMiddle AfricaMoldovaMoroccoNepalNetherlandsNicaraguaNigeriaNorth AmericaNorth MacedoniaNorthern AfricaNorthern EuropeNorwayOceaniaPakistanPanamaPeruPhilippinesPolandPortugalRomaniaRussiaSaudi ArabiaScotlandSenegalSerbiaSierra LeoneSingaporeSomaliaSouth AfricaSouth AmericaSouth Central AsiaSouth Eastern AsiaSouthern EuropeSpainSri LankaSt. Vincent and the GrenadinesSudanSwedenSwitzerlandSyriaTaiwanThailandTrinidad and TobagoTurkeyUgandaUkraineUruguayUzbekistanVenezuelaVietnamWest IndiesWestern AfricaWestern AsiaWestern EuropeYemenZimbabweAzores
Immigrants from Zaire
Race
Ancestry
AfghanAfricanAlaska NativeAlaskan AthabascanAlbanianAleutAlsatianAmericanApacheArabArapahoArgentineanArmenianAssyrian/Chaldean/SyriacAustralianAustrianBahamianBangladeshiBarbadianBasqueBelgianBelizeanBermudanBhutaneseBlackfeetBolivianBrazilianBritishBritish West IndianBulgarianBurmeseCajunCambodianCanadianCape VerdeanCarpatho RusynCelticCentral AmericanCentral American IndianCherokeeCheyenneChickasawChileanChineseChippewaChoctawColombianColvilleComancheCosta RicanCreeCreekCroatianCrowCubanCypriotCzechCzechoslovakianDanishDelawareDominicanDutchDutch West IndianEastern EuropeanEcuadorianEgyptianEnglishEstonianEthiopianEuropeanFijianFilipinoFinnishFrenchFrench American IndianFrench CanadianGermanGerman RussianGhanaianGreekGuamanian/ChamorroGuatemalanGuyaneseHaitianHmongHonduranHopiHoumaHungarianIcelanderIndian (Asian)IndonesianInupiatIraqiIrishIroquoisIsraeliItalianJamaicanJapaneseJordanianKenyanKiowaKoreanLaotianLatvianLebaneseLiberianLithuanianLumbeeLuxembourgerMacedonianMalaysianMalteseMarshalleseMenomineeMexicanMexican American IndianMongolianMoroccanNative HawaiianNavajoNepaleseNew ZealanderNicaraguanNigerianNorthern EuropeanNorwegianOkinawanOsageOttawaPaiutePakistaniPalestinianPanamanianParaguayanPennsylvania GermanPeruvianPimaPolishPortuguesePotawatomiPuebloPuerto RicanPuget Sound SalishRomanianRussianSalvadoranSamoanScandinavianScotch-IrishScottishSeminoleSenegaleseSerbianShoshoneSierra LeoneanSiouxSlavicSlovakSloveneSomaliSouth AfricanSouth AmericanSouth American IndianSoviet UnionSpaniardSpanishSpanish AmericanSpanish American IndianSri LankanSubsaharan AfricanSudaneseSwedishSwissSyrianTaiwaneseThaiTlingit-HaidaTohono O'OdhamTonganTrinidadian and TobagonianTsimshianTurkishU.S. Virgin IslanderUgandanUkrainianUruguayanUteVenezuelanVietnameseWelshWest IndianYakamaYaquiYugoslavianYumanYup'ikZimbabwean
Immigration
NonimmigrantsImmigrantsAfghanistanAfricaAlbaniaArgentinaArmeniaAsiaAustraliaAustriaBahamasBangladeshBarbadosBelarusBelgiumBelizeBoliviaBosnia and HerzegovinaBrazilBulgariaBurma/MyanmarCabo VerdeCambodiaCameroonCanadaCaribbeanCentral AmericaChileChinaColombiaCongoCosta RicaCroatiaCubaCzechoslovakiaDenmarkDominicaDominican RepublicEastern AfricaEastern AsiaEastern EuropeEcuadorEgyptEl SalvadorEnglandEritreaEthiopiaEuropeFijiFranceGermanyGhanaGreeceGrenadaGuatemalaGuyanaHaitiHondurasHong KongHungaryIndiaIndonesiaIranIraqIrelandIsraelItalyJamaicaJapanJordanKazakhstanKenyaKoreaKuwaitLaosLatin AmericaLatviaLebanonLiberiaLithuaniaMalaysiaMexicoMicronesiaMiddle AfricaMoldovaMoroccoNepalNetherlandsNicaraguaNigeriaNorth AmericaNorth MacedoniaNorthern AfricaNorthern EuropeNorwayOceaniaPakistanPanamaPeruPhilippinesPolandPortugalRomaniaRussiaSaudi ArabiaScotlandSenegalSerbiaSierra LeoneSingaporeSomaliaSouth AfricaSouth AmericaSouth Central AsiaSouth Eastern AsiaSouthern EuropeSpainSri LankaSt. Vincent and the GrenadinesSudanSwedenSwitzerlandSyriaTaiwanThailandTrinidad and TobagoTurkeyUgandaUkraineUruguayUzbekistanVenezuelaVietnamWest IndiesWestern AfricaWestern AsiaWestern EuropeYemenZaireZimbabweAzores
Householder Income Ages 25 - 44 years
Income
Poverty
Unemployment
Labor Participation
Family Structure
Vehicle Availability
Education Level
Disability

Householder Income Ages 25 - 44 years Comparison

Iranians

Immigrants from Zaire

Exceptional
Tragic
$120,292
HOUSEHOLDER INCOME AGES 25 - 44 YEARS
100.0/ 100
METRIC RATING
8th/ 347
METRIC RANK
$78,045
HOUSEHOLDER INCOME AGES 25 - 44 YEARS
0.0/ 100
METRIC RATING
321st/ 347
METRIC RANK

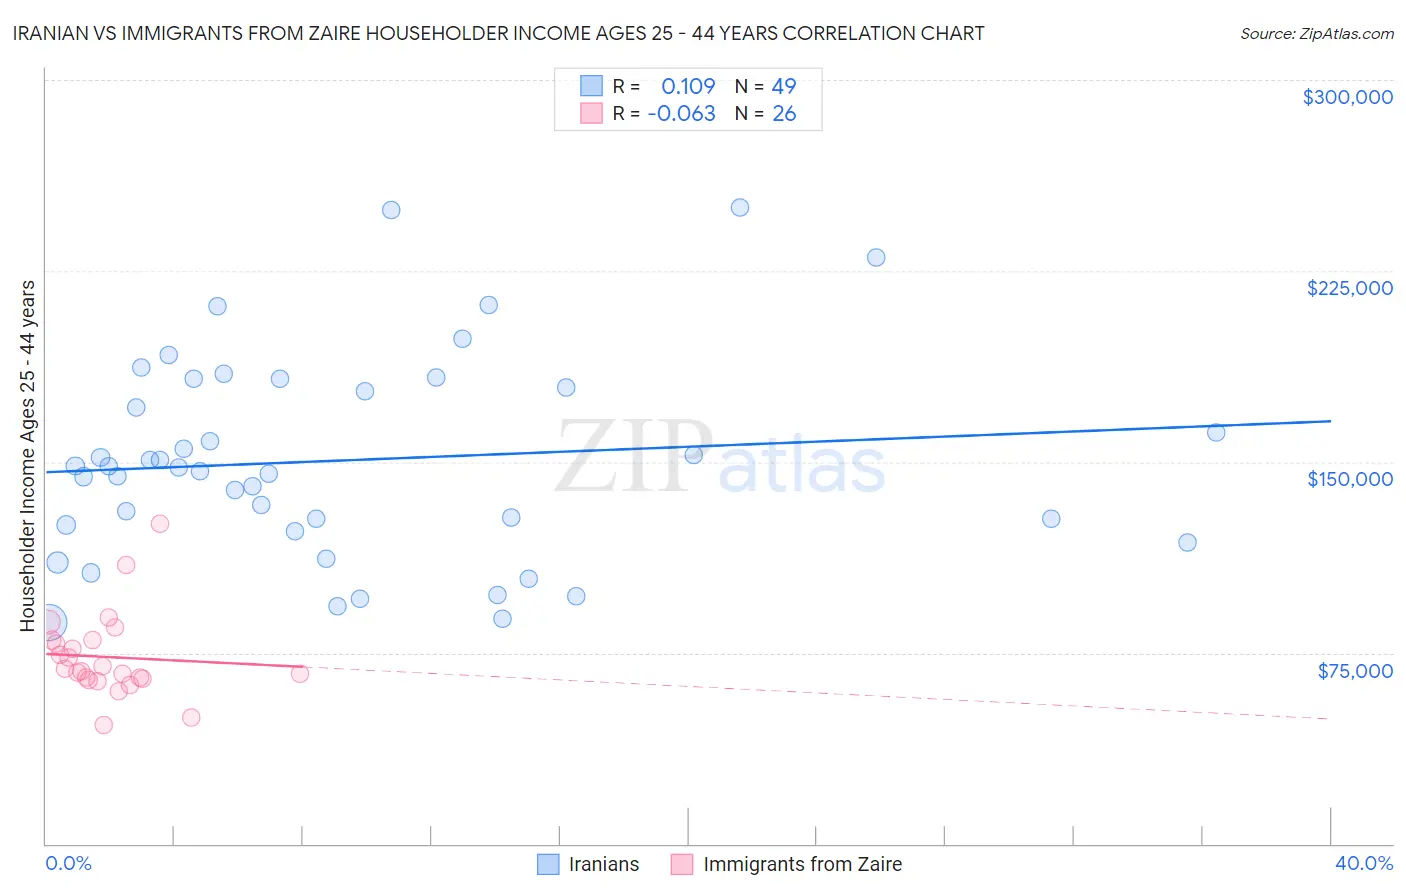
Iranian vs Immigrants from Zaire Householder Income Ages 25 - 44 years Correlation Chart

The statistical analysis conducted on geographies consisting of 316,256,370 people shows a poor positive correlation between the proportion of Iranians and household income with householder between the ages 25 and 44 in the United States with a correlation coefficient (R) of 0.109 and weighted average of $120,292. Similarly, the statistical analysis conducted on geographies consisting of 107,186,702 people shows a slight negative correlation between the proportion of Immigrants from Zaire and household income with householder between the ages 25 and 44 in the United States with a correlation coefficient (R) of -0.063 and weighted average of $78,045, a difference of 54.1%.
Iranian vs Immigrants from Zaire Householder Income Ages 25 - 44 years

Householder Income Ages 25 - 44 years Correlation Summary

MeasurementIranianImmigrants from Zaire
Minimum$87,093$46,875
Maximum$250,001$125,889
Range$162,908$79,014
Mean$150,667$73,350
Median$147,708$68,084
Interquartile 25% (IQ1)$124,074$64,948
Interquartile 75% (IQ3)$181,001$79,800
Interquartile Range (IQR)$56,927$14,852
Standard Deviation (Sample)$40,122$16,583
Standard Deviation (Population)$39,710$16,261

Similar Demographics by Householder Income Ages 25 - 44 years

Demographics Similar to Iranians by Householder Income Ages 25 - 44 years

In terms of householder income ages 25 - 44 years, the demographic groups most similar to Iranians are Immigrants from Ireland ($120,333, a difference of 0.030%), Immigrants from China ($119,756, a difference of 0.45%), Indian (Asian) ($119,496, a difference of 0.67%), Okinawan ($119,349, a difference of 0.79%), and Immigrants from Iran ($119,204, a difference of 0.91%).
DemographicsRating | RankHouseholder Income Ages 25 - 44 years
Immigrants | Taiwan
100.0
/100
|
#1
Exceptional
$129,122
Filipinos
100.0
/100
|
#2
Exceptional
$128,723
Immigrants | Hong Kong
100.0
/100
|
#3
Exceptional
$128,140
Immigrants | Singapore
100.0
/100
|
#4
Exceptional
$124,429
Immigrants | India
100.0
/100
|
#5
Exceptional
$124,238
Thais
100.0
/100
|
#6
Exceptional
$121,778
Immigrants | Ireland
100.0
/100
|
#7
Exceptional
$120,333
Iranians
100.0
/100
|
#8
Exceptional
$120,292
Immigrants | China
100.0
/100
|
#9
Exceptional
$119,756
Indians (Asian)
100.0
/100
|
#10
Exceptional
$119,496
Okinawans
100.0
/100
|
#11
Exceptional
$119,349
Immigrants | Iran
100.0
/100
|
#12
Exceptional
$119,204
Immigrants | Eastern Asia
100.0
/100
|
#13
Exceptional
$118,056
Immigrants | Israel
100.0
/100
|
#14
Exceptional
$117,219
Immigrants | South Central Asia
100.0
/100
|
#15
Exceptional
$116,626

Demographics Similar to Immigrants from Zaire by Householder Income Ages 25 - 44 years

In terms of householder income ages 25 - 44 years, the demographic groups most similar to Immigrants from Zaire are Chickasaw ($77,929, a difference of 0.15%), Choctaw ($78,168, a difference of 0.16%), Honduran ($78,540, a difference of 0.63%), Immigrants from Honduras ($77,328, a difference of 0.93%), and Immigrants from Mexico ($78,809, a difference of 0.98%).
DemographicsRating | RankHouseholder Income Ages 25 - 44 years
Cheyenne
0.0
/100
|
#314
Tragic
$79,152
Ottawa
0.0
/100
|
#315
Tragic
$79,012
Africans
0.0
/100
|
#316
Tragic
$78,986
U.S. Virgin Islanders
0.0
/100
|
#317
Tragic
$78,911
Immigrants | Mexico
0.0
/100
|
#318
Tragic
$78,809
Hondurans
0.0
/100
|
#319
Tragic
$78,540
Choctaw
0.0
/100
|
#320
Tragic
$78,168
Immigrants | Zaire
0.0
/100
|
#321
Tragic
$78,045
Chickasaw
0.0
/100
|
#322
Tragic
$77,929
Immigrants | Honduras
0.0
/100
|
#323
Tragic
$77,328
Dutch West Indians
0.0
/100
|
#324
Tragic
$77,260
Sioux
0.0
/100
|
#325
Tragic
$77,089
Houma
0.0
/100
|
#326
Tragic
$77,044
Immigrants | Bahamas
0.0
/100
|
#327
Tragic
$76,910
Immigrants | Cuba
0.0
/100
|
#328
Tragic
$76,701