Crow vs Immigrants from Honduras Single Father Households
COMPARE
Crow
Immigrants from Honduras
Single Father Households
Single Father Households Comparison
Crow
Immigrants from Honduras
3.5%
SINGLE FATHER HOUSEHOLDS
0.0/ 100
METRIC RATING
341st/ 347
METRIC RANK
2.8%
SINGLE FATHER HOUSEHOLDS
0.0/ 100
METRIC RATING
303rd/ 347
METRIC RANK
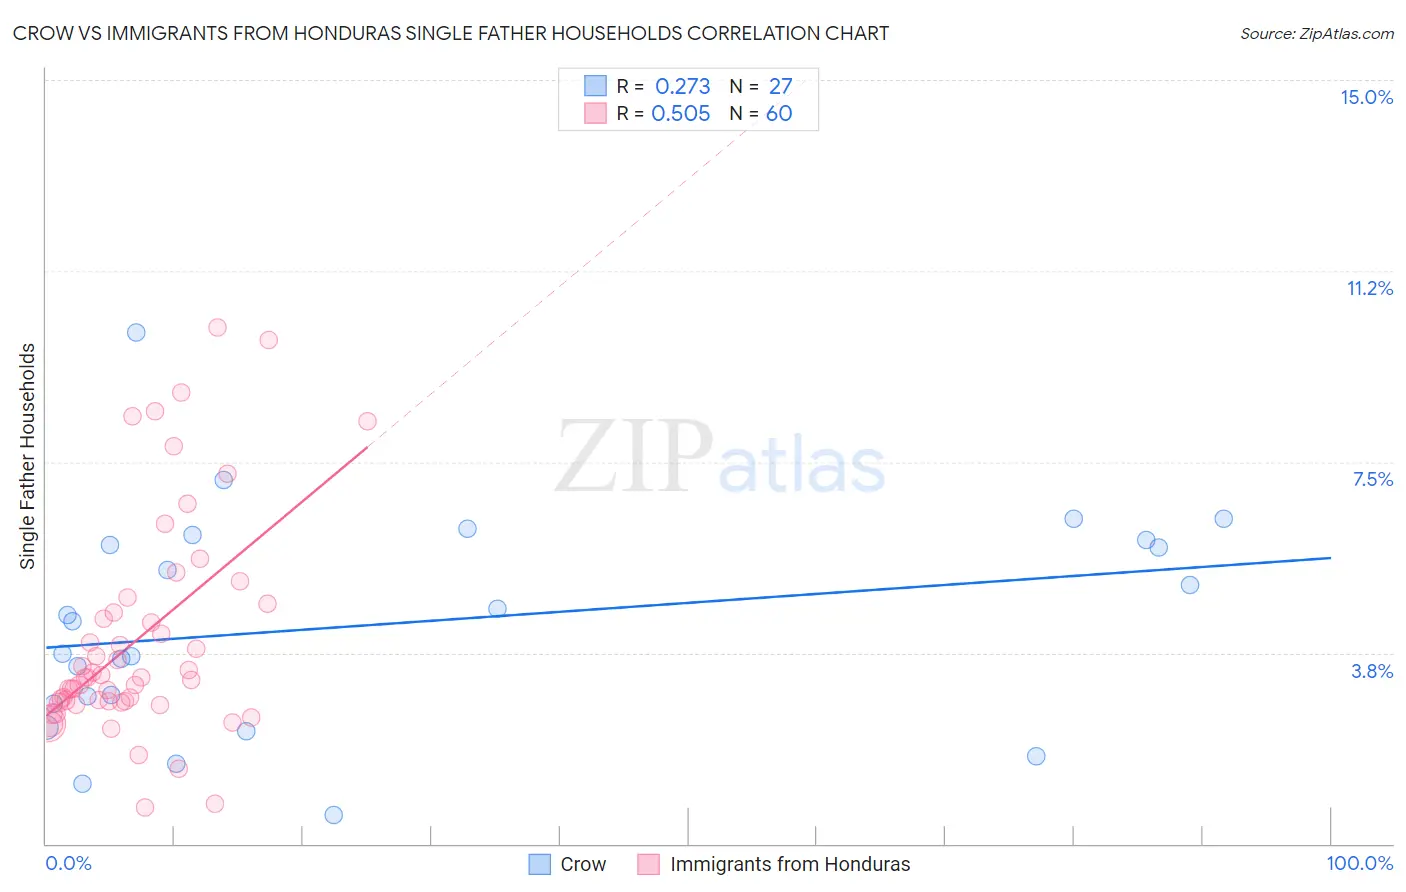
Crow vs Immigrants from Honduras Single Father Households Correlation Chart
The statistical analysis conducted on geographies consisting of 59,051,704 people shows a weak positive correlation between the proportion of Crow and percentage of single father households in the United States with a correlation coefficient (R) of 0.273 and weighted average of 3.5%. Similarly, the statistical analysis conducted on geographies consisting of 320,953,127 people shows a substantial positive correlation between the proportion of Immigrants from Honduras and percentage of single father households in the United States with a correlation coefficient (R) of 0.505 and weighted average of 2.8%, a difference of 25.2%.
Single Father Households Correlation Summary
| Measurement | Crow | Immigrants from Honduras |
| Minimum | 0.55% | 0.70% |
| Maximum | 10.0% | 10.1% |
| Range | 9.5% | 9.4% |
| Mean | 4.3% | 4.0% |
| Median | 4.4% | 3.3% |
| Interquartile 25% (IQ1) | 2.7% | 2.8% |
| Interquartile 75% (IQ3) | 6.0% | 4.6% |
| Interquartile Range (IQR) | 3.2% | 1.9% |
| Standard Deviation (Sample) | 2.1% | 2.2% |
| Standard Deviation (Population) | 2.1% | 2.1% |
Similar Demographics by Single Father Households
Demographics Similar to Crow by Single Father Households
In terms of single father households, the demographic groups most similar to Crow are Alaska Native (3.5%, a difference of 0.35%), Alaskan Athabascan (3.4%, a difference of 4.1%), Sioux (3.3%, a difference of 5.6%), Pueblo (3.3%, a difference of 6.4%), and Paiute (3.3%, a difference of 6.6%).
| Demographics | Rating | Rank | Single Father Households |
| Natives/Alaskans | 0.0 /100 | #333 | Tragic 3.2% |
| Yuman | 0.0 /100 | #334 | Tragic 3.3% |
| Colville | 0.0 /100 | #335 | Tragic 3.3% |
| Paiute | 0.0 /100 | #336 | Tragic 3.3% |
| Pueblo | 0.0 /100 | #337 | Tragic 3.3% |
| Sioux | 0.0 /100 | #338 | Tragic 3.3% |
| Alaskan Athabascans | 0.0 /100 | #339 | Tragic 3.4% |
| Alaska Natives | 0.0 /100 | #340 | Tragic 3.5% |
| Crow | 0.0 /100 | #341 | Tragic 3.5% |
| Tohono O'odham | 0.0 /100 | #342 | Tragic 3.8% |
| Pima | 0.0 /100 | #343 | Tragic 4.2% |
| Yakama | 0.0 /100 | #344 | Tragic 4.2% |
| Menominee | 0.0 /100 | #345 | Tragic 4.2% |
| Inupiat | 0.0 /100 | #346 | Tragic 4.9% |
| Yup'ik | 0.0 /100 | #347 | Tragic 5.4% |
Demographics Similar to Immigrants from Honduras by Single Father Households
In terms of single father households, the demographic groups most similar to Immigrants from Honduras are Spanish American (2.8%, a difference of 0.020%), Mexican American Indian (2.8%, a difference of 0.32%), Hispanic or Latino (2.8%, a difference of 0.47%), Immigrants from Latin America (2.8%, a difference of 0.55%), and Kiowa (2.8%, a difference of 0.60%).
| Demographics | Rating | Rank | Single Father Households |
| Japanese | 0.0 /100 | #296 | Tragic 2.8% |
| Hondurans | 0.0 /100 | #297 | Tragic 2.8% |
| Cree | 0.0 /100 | #298 | Tragic 2.8% |
| Lumbee | 0.0 /100 | #299 | Tragic 2.8% |
| Kiowa | 0.0 /100 | #300 | Tragic 2.8% |
| Immigrants | Latin America | 0.0 /100 | #301 | Tragic 2.8% |
| Spanish Americans | 0.0 /100 | #302 | Tragic 2.8% |
| Immigrants | Honduras | 0.0 /100 | #303 | Tragic 2.8% |
| Mexican American Indians | 0.0 /100 | #304 | Tragic 2.8% |
| Hispanics or Latinos | 0.0 /100 | #305 | Tragic 2.8% |
| Immigrants | Azores | 0.0 /100 | #306 | Tragic 2.8% |
| Hopi | 0.0 /100 | #307 | Tragic 2.8% |
| Apache | 0.0 /100 | #308 | Tragic 2.8% |
| Central Americans | 0.0 /100 | #309 | Tragic 2.9% |
| Immigrants | Laos | 0.0 /100 | #310 | Tragic 2.9% |