Immigrants from Guatemala vs Immigrants from Honduras Single Father Households
COMPARE
Immigrants from Guatemala
Immigrants from Honduras
Single Father Households
Single Father Households Comparison
Immigrants from Guatemala
Immigrants from Honduras
3.0%
SINGLE FATHER HOUSEHOLDS
0.0/ 100
METRIC RATING
322nd/ 347
METRIC RANK
2.8%
SINGLE FATHER HOUSEHOLDS
0.0/ 100
METRIC RATING
303rd/ 347
METRIC RANK
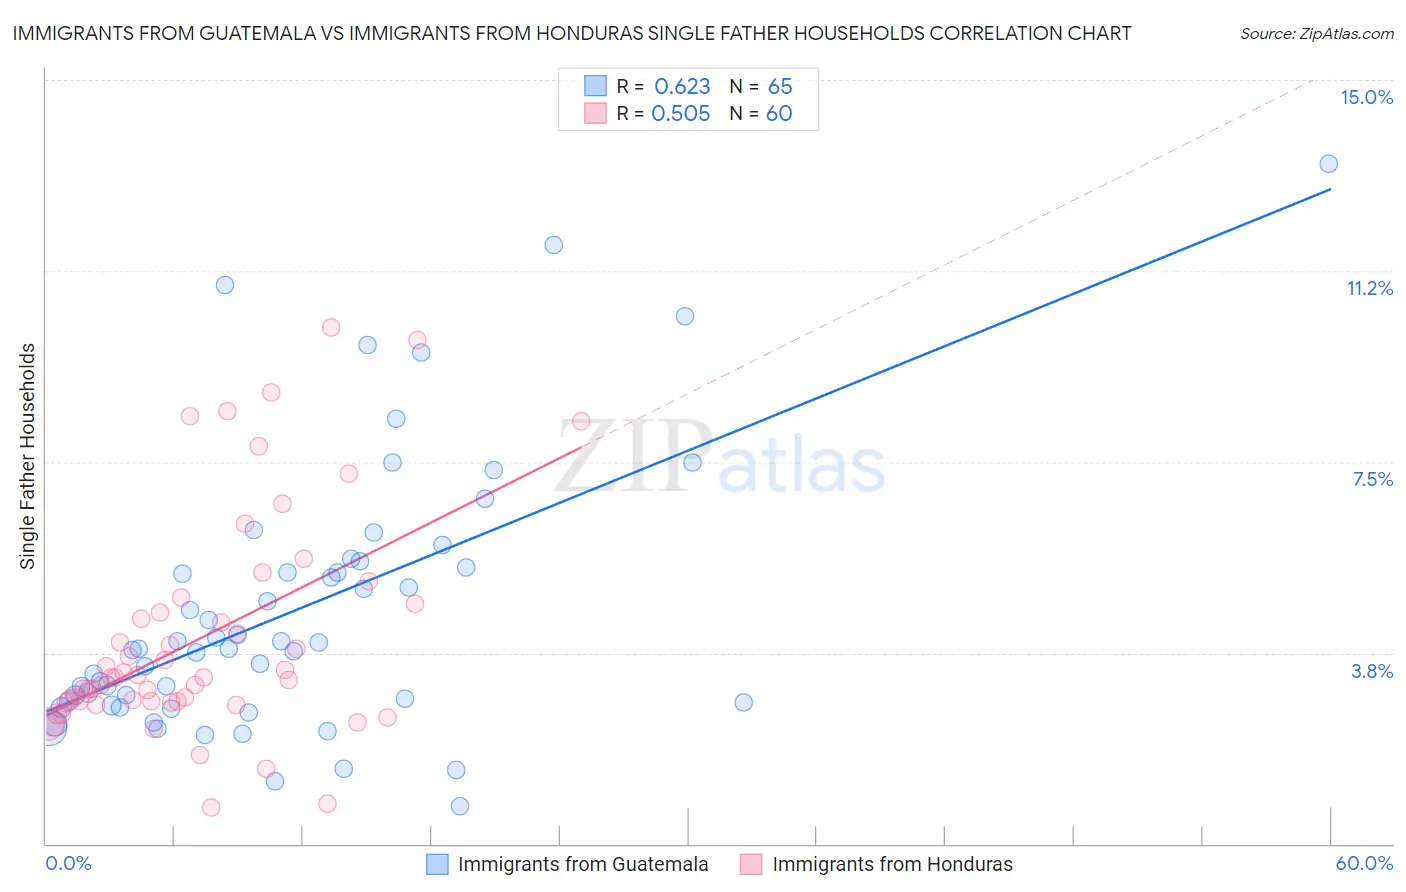
Immigrants from Guatemala vs Immigrants from Honduras Single Father Households Correlation Chart
The statistical analysis conducted on geographies consisting of 375,081,756 people shows a significant positive correlation between the proportion of Immigrants from Guatemala and percentage of single father households in the United States with a correlation coefficient (R) of 0.623 and weighted average of 3.0%. Similarly, the statistical analysis conducted on geographies consisting of 320,953,127 people shows a substantial positive correlation between the proportion of Immigrants from Honduras and percentage of single father households in the United States with a correlation coefficient (R) of 0.505 and weighted average of 2.8%, a difference of 6.6%.
Single Father Households Correlation Summary
| Measurement | Immigrants from Guatemala | Immigrants from Honduras |
| Minimum | 0.73% | 0.70% |
| Maximum | 13.4% | 10.1% |
| Range | 12.6% | 9.4% |
| Mean | 4.6% | 4.0% |
| Median | 3.8% | 3.3% |
| Interquartile 25% (IQ1) | 2.7% | 2.8% |
| Interquartile 75% (IQ3) | 5.5% | 4.6% |
| Interquartile Range (IQR) | 2.7% | 1.9% |
| Standard Deviation (Sample) | 2.6% | 2.2% |
| Standard Deviation (Population) | 2.6% | 2.1% |
Demographics Similar to Immigrants from Guatemala and Immigrants from Honduras by Single Father Households
In terms of single father households, the demographic groups most similar to Immigrants from Guatemala are Mexican (3.0%, a difference of 0.53%), Guatemalan (3.0%, a difference of 0.92%), Ute (3.0%, a difference of 1.0%), Cape Verdean (2.9%, a difference of 1.5%), and Immigrants from El Salvador (2.9%, a difference of 1.5%). Similarly, the demographic groups most similar to Immigrants from Honduras are Spanish American (2.8%, a difference of 0.020%), Mexican American Indian (2.8%, a difference of 0.32%), Hispanic or Latino (2.8%, a difference of 0.47%), Immigrants from the Azores (2.8%, a difference of 0.63%), and Hopi (2.8%, a difference of 0.79%).
| Demographics | Rating | Rank | Single Father Households |
| Spanish Americans | 0.0 /100 | #302 | Tragic 2.8% |
| Immigrants | Honduras | 0.0 /100 | #303 | Tragic 2.8% |
| Mexican American Indians | 0.0 /100 | #304 | Tragic 2.8% |
| Hispanics or Latinos | 0.0 /100 | #305 | Tragic 2.8% |
| Immigrants | Azores | 0.0 /100 | #306 | Tragic 2.8% |
| Hopi | 0.0 /100 | #307 | Tragic 2.8% |
| Apache | 0.0 /100 | #308 | Tragic 2.8% |
| Central Americans | 0.0 /100 | #309 | Tragic 2.9% |
| Immigrants | Laos | 0.0 /100 | #310 | Tragic 2.9% |
| Spanish American Indians | 0.0 /100 | #311 | Tragic 2.9% |
| Tsimshian | 0.0 /100 | #312 | Tragic 2.9% |
| Arapaho | 0.0 /100 | #313 | Tragic 2.9% |
| Salvadorans | 0.0 /100 | #314 | Tragic 2.9% |
| Cheyenne | 0.0 /100 | #315 | Tragic 2.9% |
| Houma | 0.0 /100 | #316 | Tragic 2.9% |
| Immigrants | El Salvador | 0.0 /100 | #317 | Tragic 2.9% |
| Cape Verdeans | 0.0 /100 | #318 | Tragic 2.9% |
| Ute | 0.0 /100 | #319 | Tragic 3.0% |
| Guatemalans | 0.0 /100 | #320 | Tragic 3.0% |
| Mexicans | 0.0 /100 | #321 | Tragic 3.0% |
| Immigrants | Guatemala | 0.0 /100 | #322 | Tragic 3.0% |