Scotch-Irish vs Immigrants from Honduras Single Father Households
COMPARE
Scotch-Irish
Immigrants from Honduras
Single Father Households
Single Father Households Comparison
Scotch-Irish
Immigrants from Honduras
2.3%
SINGLE FATHER HOUSEHOLDS
69.4/ 100
METRIC RATING
165th/ 347
METRIC RANK
2.8%
SINGLE FATHER HOUSEHOLDS
0.0/ 100
METRIC RATING
303rd/ 347
METRIC RANK
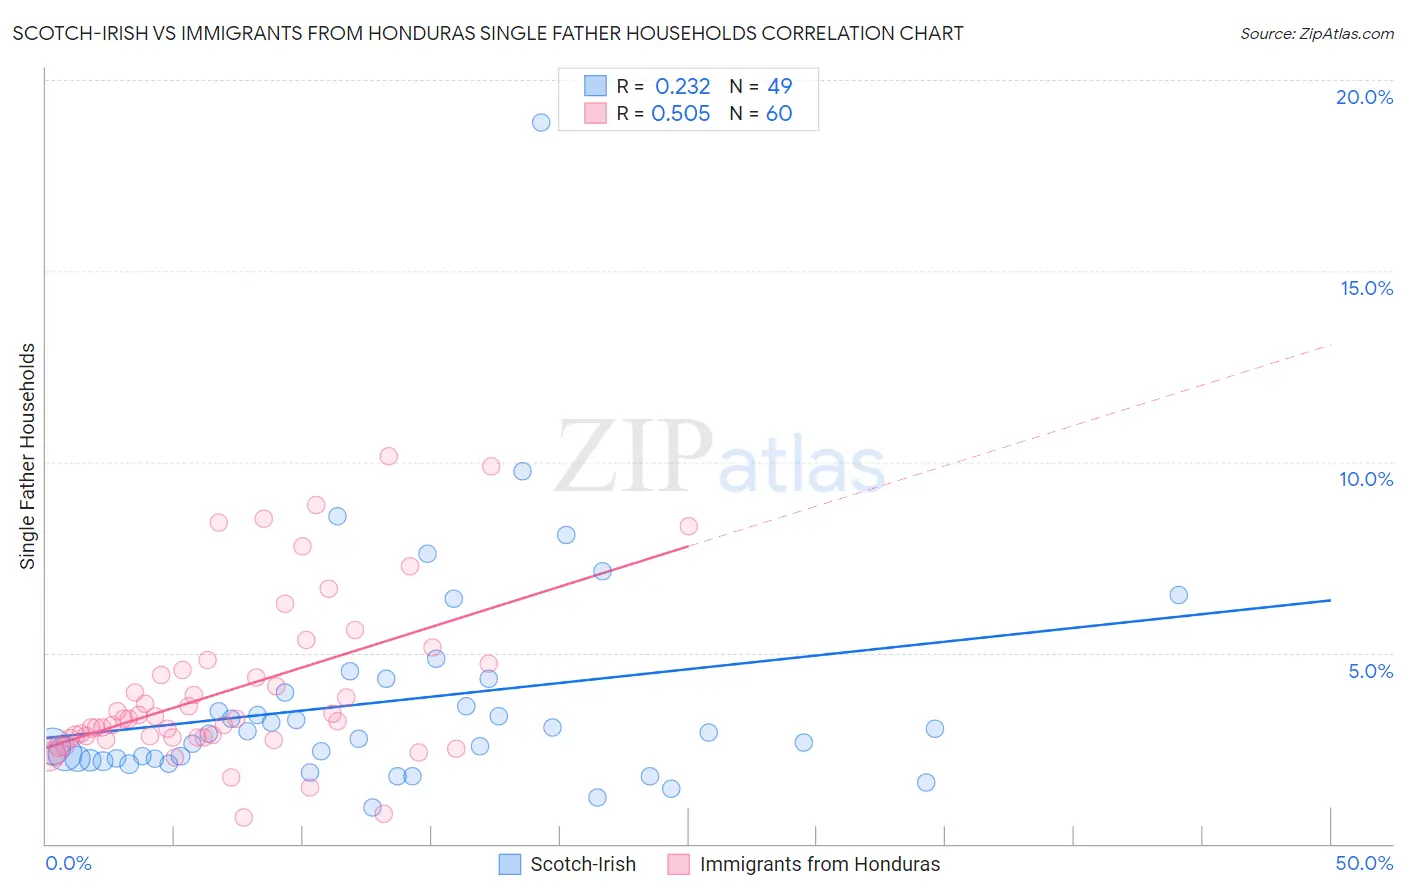
Scotch-Irish vs Immigrants from Honduras Single Father Households Correlation Chart
The statistical analysis conducted on geographies consisting of 535,957,408 people shows a weak positive correlation between the proportion of Scotch-Irish and percentage of single father households in the United States with a correlation coefficient (R) of 0.232 and weighted average of 2.3%. Similarly, the statistical analysis conducted on geographies consisting of 320,953,127 people shows a substantial positive correlation between the proportion of Immigrants from Honduras and percentage of single father households in the United States with a correlation coefficient (R) of 0.505 and weighted average of 2.8%, a difference of 21.9%.
Single Father Households Correlation Summary
| Measurement | Scotch-Irish | Immigrants from Honduras |
| Minimum | 0.96% | 0.70% |
| Maximum | 18.9% | 10.1% |
| Range | 17.9% | 9.4% |
| Mean | 3.7% | 4.0% |
| Median | 2.9% | 3.3% |
| Interquartile 25% (IQ1) | 2.2% | 2.8% |
| Interquartile 75% (IQ3) | 4.1% | 4.6% |
| Interquartile Range (IQR) | 1.9% | 1.9% |
| Standard Deviation (Sample) | 3.0% | 2.2% |
| Standard Deviation (Population) | 3.0% | 2.1% |
Similar Demographics by Single Father Households
Demographics Similar to Scotch-Irish by Single Father Households
In terms of single father households, the demographic groups most similar to Scotch-Irish are English (2.3%, a difference of 0.070%), Pakistani (2.3%, a difference of 0.10%), Irish (2.3%, a difference of 0.24%), Scottish (2.3%, a difference of 0.31%), and Swiss (2.3%, a difference of 0.35%).
| Demographics | Rating | Rank | Single Father Households |
| Immigrants | Senegal | 79.4 /100 | #158 | Good 2.3% |
| Immigrants | West Indies | 77.9 /100 | #159 | Good 2.3% |
| Immigrants | Bolivia | 76.3 /100 | #160 | Good 2.3% |
| Swiss | 73.2 /100 | #161 | Good 2.3% |
| Scottish | 72.8 /100 | #162 | Good 2.3% |
| Irish | 72.1 /100 | #163 | Good 2.3% |
| Pakistanis | 70.6 /100 | #164 | Good 2.3% |
| Scotch-Irish | 69.4 /100 | #165 | Good 2.3% |
| English | 68.6 /100 | #166 | Good 2.3% |
| South Americans | 64.3 /100 | #167 | Good 2.3% |
| Icelanders | 63.1 /100 | #168 | Good 2.3% |
| Czechs | 62.5 /100 | #169 | Good 2.3% |
| Ugandans | 62.2 /100 | #170 | Good 2.3% |
| Swedes | 61.6 /100 | #171 | Good 2.3% |
| Czechoslovakians | 58.9 /100 | #172 | Average 2.3% |
Demographics Similar to Immigrants from Honduras by Single Father Households
In terms of single father households, the demographic groups most similar to Immigrants from Honduras are Spanish American (2.8%, a difference of 0.020%), Mexican American Indian (2.8%, a difference of 0.32%), Hispanic or Latino (2.8%, a difference of 0.47%), Immigrants from Latin America (2.8%, a difference of 0.55%), and Kiowa (2.8%, a difference of 0.60%).
| Demographics | Rating | Rank | Single Father Households |
| Japanese | 0.0 /100 | #296 | Tragic 2.8% |
| Hondurans | 0.0 /100 | #297 | Tragic 2.8% |
| Cree | 0.0 /100 | #298 | Tragic 2.8% |
| Lumbee | 0.0 /100 | #299 | Tragic 2.8% |
| Kiowa | 0.0 /100 | #300 | Tragic 2.8% |
| Immigrants | Latin America | 0.0 /100 | #301 | Tragic 2.8% |
| Spanish Americans | 0.0 /100 | #302 | Tragic 2.8% |
| Immigrants | Honduras | 0.0 /100 | #303 | Tragic 2.8% |
| Mexican American Indians | 0.0 /100 | #304 | Tragic 2.8% |
| Hispanics or Latinos | 0.0 /100 | #305 | Tragic 2.8% |
| Immigrants | Azores | 0.0 /100 | #306 | Tragic 2.8% |
| Hopi | 0.0 /100 | #307 | Tragic 2.8% |
| Apache | 0.0 /100 | #308 | Tragic 2.8% |
| Central Americans | 0.0 /100 | #309 | Tragic 2.9% |
| Immigrants | Laos | 0.0 /100 | #310 | Tragic 2.9% |