Navajo vs Immigrants from Honduras Single Father Households
COMPARE
Navajo
Immigrants from Honduras
Single Father Households
Single Father Households Comparison
Navajo
Immigrants from Honduras
3.2%
SINGLE FATHER HOUSEHOLDS
0.0/ 100
METRIC RATING
331st/ 347
METRIC RANK
2.8%
SINGLE FATHER HOUSEHOLDS
0.0/ 100
METRIC RATING
303rd/ 347
METRIC RANK
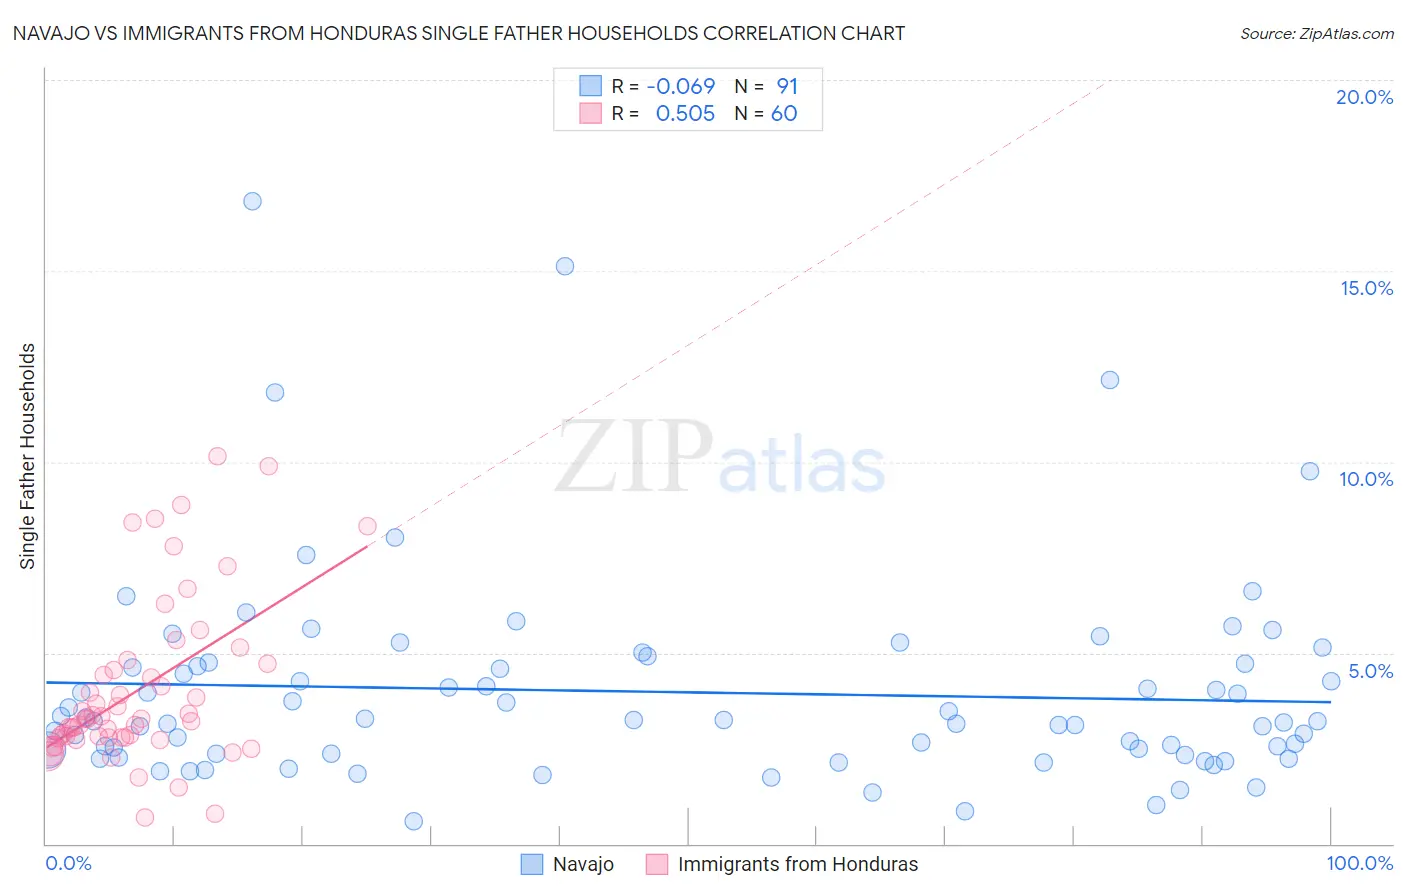
Navajo vs Immigrants from Honduras Single Father Households Correlation Chart
The statistical analysis conducted on geographies consisting of 223,786,541 people shows a slight negative correlation between the proportion of Navajo and percentage of single father households in the United States with a correlation coefficient (R) of -0.069 and weighted average of 3.2%. Similarly, the statistical analysis conducted on geographies consisting of 320,953,127 people shows a substantial positive correlation between the proportion of Immigrants from Honduras and percentage of single father households in the United States with a correlation coefficient (R) of 0.505 and weighted average of 2.8%, a difference of 13.6%.
Single Father Households Correlation Summary
| Measurement | Navajo | Immigrants from Honduras |
| Minimum | 0.57% | 0.70% |
| Maximum | 16.8% | 10.1% |
| Range | 16.2% | 9.4% |
| Mean | 4.0% | 4.0% |
| Median | 3.2% | 3.3% |
| Interquartile 25% (IQ1) | 2.4% | 2.8% |
| Interquartile 75% (IQ3) | 4.7% | 4.6% |
| Interquartile Range (IQR) | 2.4% | 1.9% |
| Standard Deviation (Sample) | 2.7% | 2.2% |
| Standard Deviation (Population) | 2.7% | 2.1% |
Similar Demographics by Single Father Households
Demographics Similar to Navajo by Single Father Households
In terms of single father households, the demographic groups most similar to Navajo are Yaqui (3.2%, a difference of 0.040%), Native/Alaskan (3.2%, a difference of 0.54%), Nepalese (3.1%, a difference of 2.3%), Chippewa (3.1%, a difference of 3.2%), and Immigrants from Cabo Verde (3.1%, a difference of 3.3%).
| Demographics | Rating | Rank | Single Father Households |
| Fijians | 0.0 /100 | #324 | Tragic 3.0% |
| Immigrants | Mexico | 0.0 /100 | #325 | Tragic 3.0% |
| Aleuts | 0.0 /100 | #326 | Tragic 3.0% |
| Bangladeshis | 0.0 /100 | #327 | Tragic 3.1% |
| Immigrants | Cabo Verde | 0.0 /100 | #328 | Tragic 3.1% |
| Chippewa | 0.0 /100 | #329 | Tragic 3.1% |
| Nepalese | 0.0 /100 | #330 | Tragic 3.1% |
| Navajo | 0.0 /100 | #331 | Tragic 3.2% |
| Yaqui | 0.0 /100 | #332 | Tragic 3.2% |
| Natives/Alaskans | 0.0 /100 | #333 | Tragic 3.2% |
| Yuman | 0.0 /100 | #334 | Tragic 3.3% |
| Colville | 0.0 /100 | #335 | Tragic 3.3% |
| Paiute | 0.0 /100 | #336 | Tragic 3.3% |
| Pueblo | 0.0 /100 | #337 | Tragic 3.3% |
| Sioux | 0.0 /100 | #338 | Tragic 3.3% |
Demographics Similar to Immigrants from Honduras by Single Father Households
In terms of single father households, the demographic groups most similar to Immigrants from Honduras are Spanish American (2.8%, a difference of 0.020%), Mexican American Indian (2.8%, a difference of 0.32%), Hispanic or Latino (2.8%, a difference of 0.47%), Immigrants from Latin America (2.8%, a difference of 0.55%), and Kiowa (2.8%, a difference of 0.60%).
| Demographics | Rating | Rank | Single Father Households |
| Japanese | 0.0 /100 | #296 | Tragic 2.8% |
| Hondurans | 0.0 /100 | #297 | Tragic 2.8% |
| Cree | 0.0 /100 | #298 | Tragic 2.8% |
| Lumbee | 0.0 /100 | #299 | Tragic 2.8% |
| Kiowa | 0.0 /100 | #300 | Tragic 2.8% |
| Immigrants | Latin America | 0.0 /100 | #301 | Tragic 2.8% |
| Spanish Americans | 0.0 /100 | #302 | Tragic 2.8% |
| Immigrants | Honduras | 0.0 /100 | #303 | Tragic 2.8% |
| Mexican American Indians | 0.0 /100 | #304 | Tragic 2.8% |
| Hispanics or Latinos | 0.0 /100 | #305 | Tragic 2.8% |
| Immigrants | Azores | 0.0 /100 | #306 | Tragic 2.8% |
| Hopi | 0.0 /100 | #307 | Tragic 2.8% |
| Apache | 0.0 /100 | #308 | Tragic 2.8% |
| Central Americans | 0.0 /100 | #309 | Tragic 2.9% |
| Immigrants | Laos | 0.0 /100 | #310 | Tragic 2.9% |