Indonesian vs Puerto Rican Family Poverty
COMPARE
Indonesian
Puerto Rican
Family Poverty
Family Poverty Comparison
Indonesians
Puerto Ricans
11.3%
FAMILY POVERTY
0.0/ 100
METRIC RATING
283rd/ 347
METRIC RANK
20.3%
FAMILY POVERTY
0.0/ 100
METRIC RATING
346th/ 347
METRIC RANK
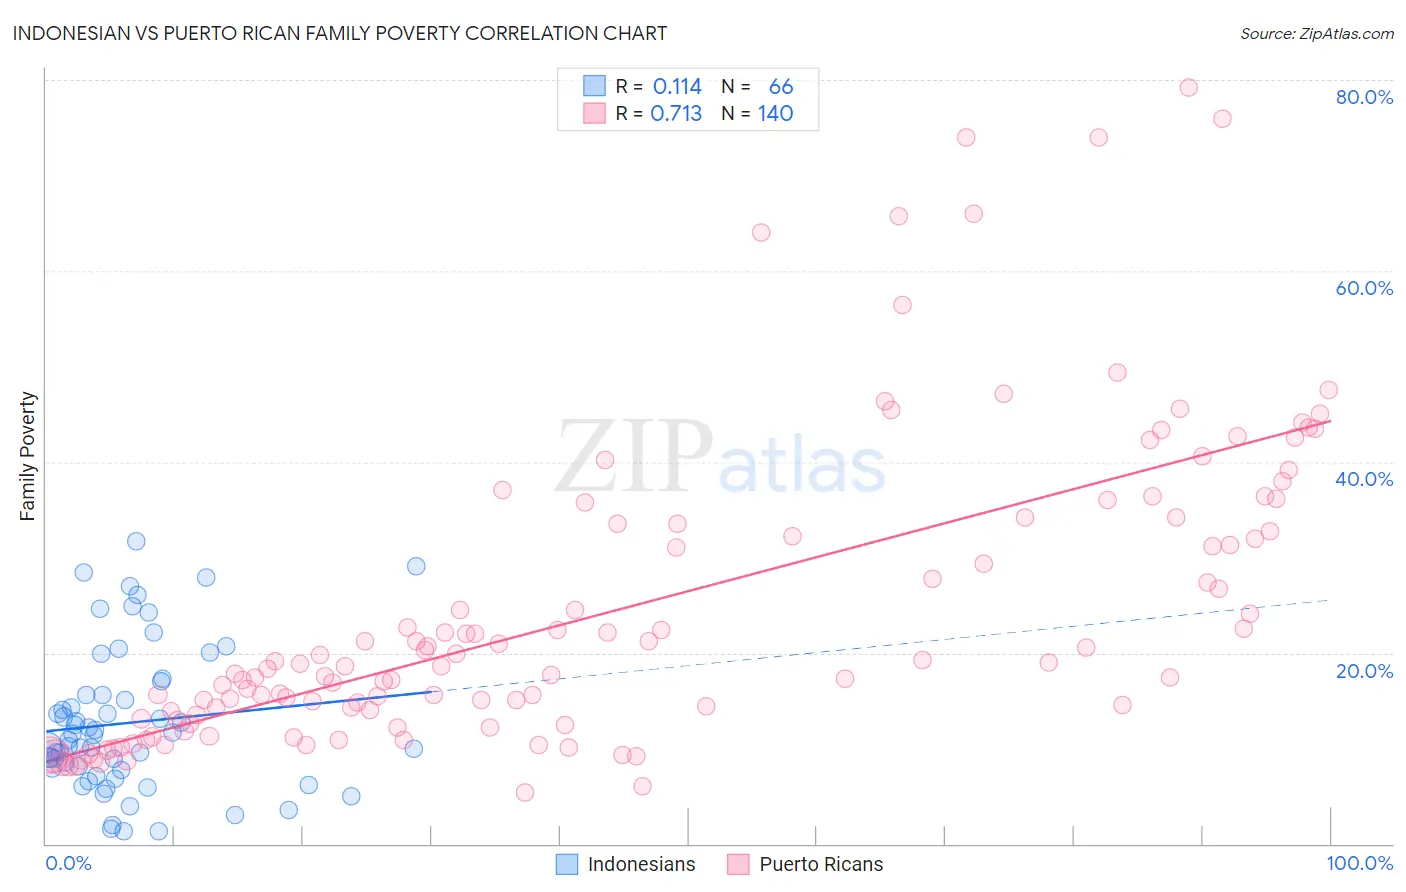
Indonesian vs Puerto Rican Family Poverty Correlation Chart
The statistical analysis conducted on geographies consisting of 162,562,549 people shows a poor positive correlation between the proportion of Indonesians and poverty level among families in the United States with a correlation coefficient (R) of 0.114 and weighted average of 11.3%. Similarly, the statistical analysis conducted on geographies consisting of 525,427,340 people shows a strong positive correlation between the proportion of Puerto Ricans and poverty level among families in the United States with a correlation coefficient (R) of 0.713 and weighted average of 20.3%, a difference of 79.4%.
Family Poverty Correlation Summary
| Measurement | Indonesian | Puerto Rican |
| Minimum | 1.3% | 5.3% |
| Maximum | 31.7% | 79.2% |
| Range | 30.4% | 73.9% |
| Mean | 12.7% | 24.4% |
| Median | 11.1% | 18.7% |
| Interquartile 25% (IQ1) | 7.7% | 13.3% |
| Interquartile 75% (IQ3) | 15.6% | 33.5% |
| Interquartile Range (IQR) | 7.9% | 20.2% |
| Standard Deviation (Sample) | 7.5% | 15.9% |
| Standard Deviation (Population) | 7.5% | 15.9% |
Similar Demographics by Family Poverty
Demographics Similar to Indonesians by Family Poverty
In terms of family poverty, the demographic groups most similar to Indonesians are Immigrants from Cuba (11.3%, a difference of 0.040%), Yaqui (11.3%, a difference of 0.12%), Barbadian (11.3%, a difference of 0.20%), Immigrants from West Indies (11.3%, a difference of 0.30%), and Belizean (11.3%, a difference of 0.57%).
| Demographics | Rating | Rank | Family Poverty |
| Immigrants | Guyana | 0.1 /100 | #276 | Tragic 11.2% |
| Chippewa | 0.1 /100 | #277 | Tragic 11.2% |
| Guyanese | 0.1 /100 | #278 | Tragic 11.2% |
| Blackfeet | 0.0 /100 | #279 | Tragic 11.3% |
| Belizeans | 0.0 /100 | #280 | Tragic 11.3% |
| Immigrants | West Indies | 0.0 /100 | #281 | Tragic 11.3% |
| Immigrants | Cuba | 0.0 /100 | #282 | Tragic 11.3% |
| Indonesians | 0.0 /100 | #283 | Tragic 11.3% |
| Yaqui | 0.0 /100 | #284 | Tragic 11.3% |
| Barbadians | 0.0 /100 | #285 | Tragic 11.3% |
| Senegalese | 0.0 /100 | #286 | Tragic 11.5% |
| Vietnamese | 0.0 /100 | #287 | Tragic 11.5% |
| Immigrants | Belize | 0.0 /100 | #288 | Tragic 11.5% |
| Immigrants | Barbados | 0.0 /100 | #289 | Tragic 11.5% |
| West Indians | 0.0 /100 | #290 | Tragic 11.5% |
Demographics Similar to Puerto Ricans by Family Poverty
In terms of family poverty, the demographic groups most similar to Puerto Ricans are Tohono O'odham (20.4%, a difference of 0.37%), Navajo (18.8%, a difference of 8.1%), Yup'ik (18.7%, a difference of 8.6%), Pima (18.4%, a difference of 10.6%), and Immigrants from Yemen (17.5%, a difference of 16.4%).
| Demographics | Rating | Rank | Family Poverty |
| Immigrants | Dominican Republic | 0.0 /100 | #333 | Tragic 14.4% |
| Houma | 0.0 /100 | #334 | Tragic 14.6% |
| Apache | 0.0 /100 | #335 | Tragic 14.7% |
| Sioux | 0.0 /100 | #336 | Tragic 15.9% |
| Hopi | 0.0 /100 | #337 | Tragic 15.9% |
| Crow | 0.0 /100 | #338 | Tragic 16.1% |
| Yuman | 0.0 /100 | #339 | Tragic 16.6% |
| Pueblo | 0.0 /100 | #340 | Tragic 17.0% |
| Lumbee | 0.0 /100 | #341 | Tragic 17.0% |
| Immigrants | Yemen | 0.0 /100 | #342 | Tragic 17.5% |
| Pima | 0.0 /100 | #343 | Tragic 18.4% |
| Yup'ik | 0.0 /100 | #344 | Tragic 18.7% |
| Navajo | 0.0 /100 | #345 | Tragic 18.8% |
| Puerto Ricans | 0.0 /100 | #346 | Tragic 20.3% |
| Tohono O'odham | 0.0 /100 | #347 | Tragic 20.4% |