Indonesian vs Immigrants from Zimbabwe Female Poverty Among 18-24 Year Olds
COMPARE
Indonesian
Immigrants from Zimbabwe
Female Poverty Among 18-24 Year Olds
Female Poverty Among 18-24 Year Olds Comparison
Indonesians
Immigrants from Zimbabwe
22.5%
FEMALE POVERTY AMONG 18-24 YEAR OLDS
0.0/ 100
METRIC RATING
294th/ 347
METRIC RANK
19.8%
FEMALE POVERTY AMONG 18-24 YEAR OLDS
76.7/ 100
METRIC RATING
154th/ 347
METRIC RANK
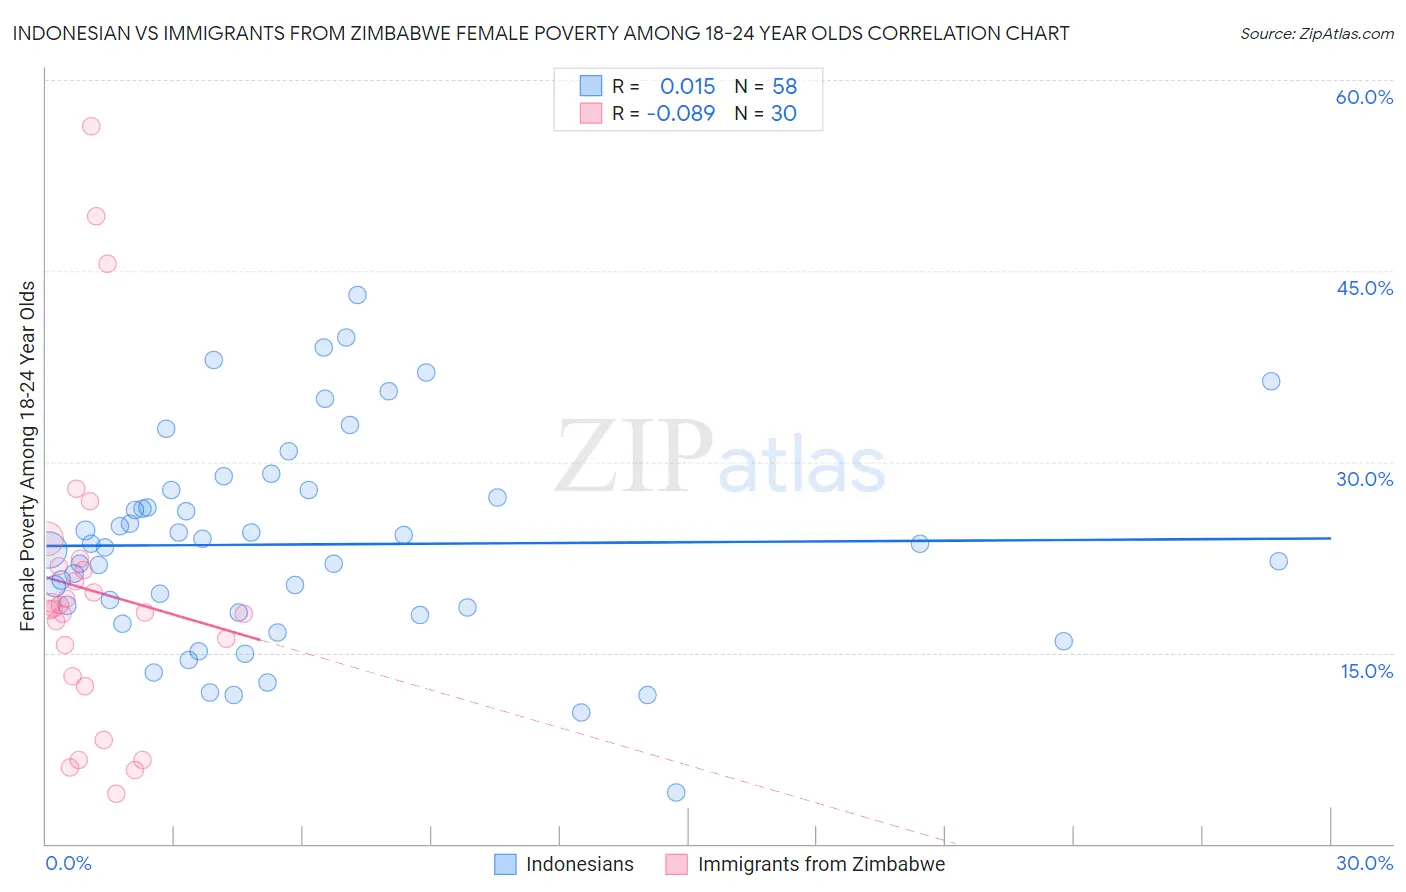
Indonesian vs Immigrants from Zimbabwe Female Poverty Among 18-24 Year Olds Correlation Chart
The statistical analysis conducted on geographies consisting of 161,434,241 people shows no correlation between the proportion of Indonesians and poverty level among females between the ages 18 and 24 in the United States with a correlation coefficient (R) of 0.015 and weighted average of 22.5%. Similarly, the statistical analysis conducted on geographies consisting of 116,895,909 people shows a slight negative correlation between the proportion of Immigrants from Zimbabwe and poverty level among females between the ages 18 and 24 in the United States with a correlation coefficient (R) of -0.089 and weighted average of 19.8%, a difference of 13.5%.
Female Poverty Among 18-24 Year Olds Correlation Summary
| Measurement | Indonesian | Immigrants from Zimbabwe |
| Minimum | 4.1% | 3.9% |
| Maximum | 43.2% | 56.3% |
| Range | 39.1% | 52.4% |
| Mean | 23.5% | 19.9% |
| Median | 23.4% | 18.4% |
| Interquartile 25% (IQ1) | 18.2% | 13.2% |
| Interquartile 75% (IQ3) | 27.8% | 21.8% |
| Interquartile Range (IQR) | 9.6% | 8.6% |
| Standard Deviation (Sample) | 8.2% | 12.2% |
| Standard Deviation (Population) | 8.1% | 12.0% |
Similar Demographics by Female Poverty Among 18-24 Year Olds
Demographics Similar to Indonesians by Female Poverty Among 18-24 Year Olds
In terms of female poverty among 18-24 year olds, the demographic groups most similar to Indonesians are U.S. Virgin Islander (22.5%, a difference of 0.030%), Alaskan Athabascan (22.5%, a difference of 0.070%), Bangladeshi (22.5%, a difference of 0.12%), Shoshone (22.5%, a difference of 0.12%), and Menominee (22.5%, a difference of 0.23%).
| Demographics | Rating | Rank | Female Poverty Among 18-24 Year Olds |
| Immigrants | Middle Africa | 0.0 /100 | #287 | Tragic 22.1% |
| Dominicans | 0.0 /100 | #288 | Tragic 22.3% |
| French American Indians | 0.0 /100 | #289 | Tragic 22.3% |
| Immigrants | Senegal | 0.0 /100 | #290 | Tragic 22.4% |
| Bangladeshis | 0.0 /100 | #291 | Tragic 22.5% |
| Alaskan Athabascans | 0.0 /100 | #292 | Tragic 22.5% |
| U.S. Virgin Islanders | 0.0 /100 | #293 | Tragic 22.5% |
| Indonesians | 0.0 /100 | #294 | Tragic 22.5% |
| Shoshone | 0.0 /100 | #295 | Tragic 22.5% |
| Menominee | 0.0 /100 | #296 | Tragic 22.5% |
| Inupiat | 0.0 /100 | #297 | Tragic 22.6% |
| Central American Indians | 0.0 /100 | #298 | Tragic 22.6% |
| Cherokee | 0.0 /100 | #299 | Tragic 22.7% |
| Africans | 0.0 /100 | #300 | Tragic 22.8% |
| Seminole | 0.0 /100 | #301 | Tragic 22.9% |
Demographics Similar to Immigrants from Zimbabwe by Female Poverty Among 18-24 Year Olds
In terms of female poverty among 18-24 year olds, the demographic groups most similar to Immigrants from Zimbabwe are Hungarian (19.8%, a difference of 0.0%), Immigrants from Belgium (19.8%, a difference of 0.020%), Danish (19.8%, a difference of 0.080%), Immigrants from Lebanon (19.8%, a difference of 0.090%), and Immigrants from Japan (19.8%, a difference of 0.10%).
| Demographics | Rating | Rank | Female Poverty Among 18-24 Year Olds |
| Immigrants | Austria | 83.1 /100 | #147 | Excellent 19.7% |
| Immigrants | Latin America | 81.3 /100 | #148 | Excellent 19.7% |
| Immigrants | Oceania | 81.2 /100 | #149 | Excellent 19.7% |
| Syrians | 80.2 /100 | #150 | Excellent 19.8% |
| Immigrants | Eastern Asia | 79.7 /100 | #151 | Good 19.8% |
| Yugoslavians | 79.0 /100 | #152 | Good 19.8% |
| Immigrants | Japan | 78.1 /100 | #153 | Good 19.8% |
| Immigrants | Zimbabwe | 76.7 /100 | #154 | Good 19.8% |
| Hungarians | 76.6 /100 | #155 | Good 19.8% |
| Immigrants | Belgium | 76.4 /100 | #156 | Good 19.8% |
| Danes | 75.5 /100 | #157 | Good 19.8% |
| Immigrants | Lebanon | 75.3 /100 | #158 | Good 19.8% |
| Trinidadians and Tobagonians | 74.4 /100 | #159 | Good 19.8% |
| Pakistanis | 74.1 /100 | #160 | Good 19.8% |
| Immigrants | Belize | 74.1 /100 | #161 | Good 19.8% |