Immigrants vs Yugoslavian Master's Degree
COMPARE
Immigrants
Yugoslavian
Master's Degree
Master's Degree Comparison
Immigrants
Yugoslavians
14.6%
MASTER'S DEGREE
36.0/ 100
METRIC RATING
189th/ 347
METRIC RANK
14.4%
MASTER'S DEGREE
24.3/ 100
METRIC RATING
203rd/ 347
METRIC RANK
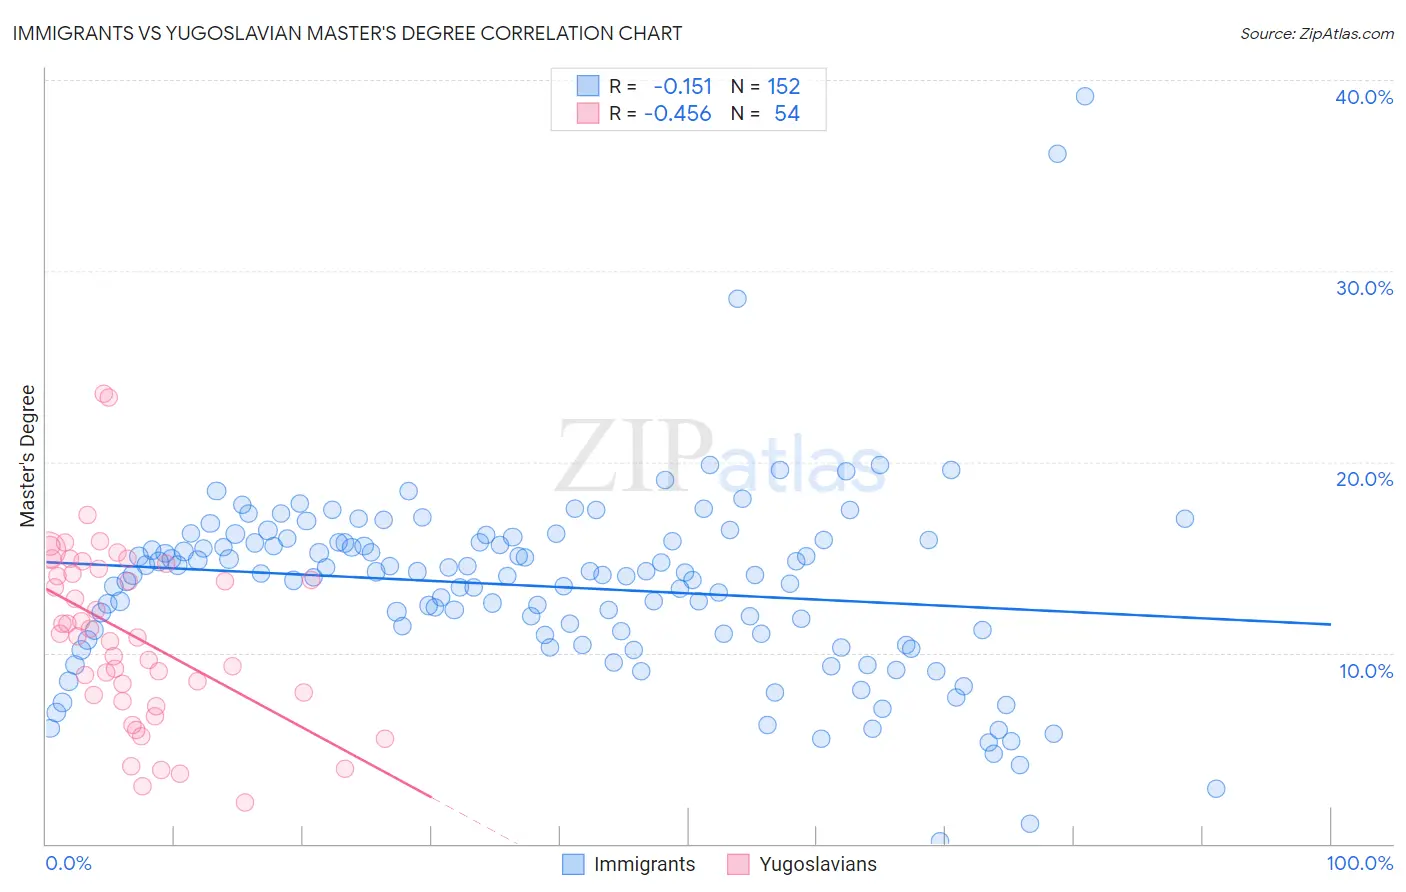
Immigrants vs Yugoslavian Master's Degree Correlation Chart
The statistical analysis conducted on geographies consisting of 576,625,000 people shows a poor negative correlation between the proportion of Immigrants and percentage of population with at least master's degree education in the United States with a correlation coefficient (R) of -0.151 and weighted average of 14.6%. Similarly, the statistical analysis conducted on geographies consisting of 285,661,106 people shows a moderate negative correlation between the proportion of Yugoslavians and percentage of population with at least master's degree education in the United States with a correlation coefficient (R) of -0.456 and weighted average of 14.4%, a difference of 1.9%.
Master's Degree Correlation Summary
| Measurement | Immigrants | Yugoslavian |
| Minimum | 0.15% | 2.2% |
| Maximum | 39.2% | 23.6% |
| Range | 39.0% | 21.4% |
| Mean | 13.5% | 10.9% |
| Median | 14.1% | 10.9% |
| Interquartile 25% (IQ1) | 11.0% | 7.8% |
| Interquartile 75% (IQ3) | 15.8% | 14.4% |
| Interquartile Range (IQR) | 4.9% | 6.6% |
| Standard Deviation (Sample) | 5.0% | 4.7% |
| Standard Deviation (Population) | 5.0% | 4.6% |
Demographics Similar to Immigrants and Yugoslavians by Master's Degree
In terms of master's degree, the demographic groups most similar to Immigrants are Spaniard (14.6%, a difference of 0.020%), Immigrants from Costa Rica (14.7%, a difference of 0.040%), Basque (14.7%, a difference of 0.080%), Immigrants from Oceania (14.7%, a difference of 0.16%), and Welsh (14.6%, a difference of 0.25%). Similarly, the demographic groups most similar to Yugoslavians are Immigrants from Western Africa (14.4%, a difference of 0.11%), French (14.4%, a difference of 0.11%), Panamanian (14.4%, a difference of 0.13%), Scotch-Irish (14.4%, a difference of 0.13%), and Trinidadian and Tobagonian (14.4%, a difference of 0.15%).
| Demographics | Rating | Rank | Master's Degree |
| Immigrants | Oceania | 37.1 /100 | #186 | Fair 14.7% |
| Basques | 36.5 /100 | #187 | Fair 14.7% |
| Immigrants | Costa Rica | 36.2 /100 | #188 | Fair 14.7% |
| Immigrants | Immigrants | 36.0 /100 | #189 | Fair 14.6% |
| Spaniards | 35.8 /100 | #190 | Fair 14.6% |
| Welsh | 34.2 /100 | #191 | Fair 14.6% |
| Immigrants | Middle Africa | 33.6 /100 | #192 | Fair 14.6% |
| Immigrants | Nigeria | 32.7 /100 | #193 | Fair 14.6% |
| Chinese | 32.5 /100 | #194 | Fair 14.6% |
| Danes | 31.3 /100 | #195 | Fair 14.5% |
| Czechoslovakians | 29.9 /100 | #196 | Fair 14.5% |
| Belgians | 28.0 /100 | #197 | Fair 14.5% |
| West Indians | 27.4 /100 | #198 | Fair 14.5% |
| Immigrants | Armenia | 27.2 /100 | #199 | Fair 14.5% |
| Panamanians | 25.1 /100 | #200 | Fair 14.4% |
| Scotch-Irish | 25.0 /100 | #201 | Fair 14.4% |
| Immigrants | Western Africa | 24.9 /100 | #202 | Fair 14.4% |
| Yugoslavians | 24.3 /100 | #203 | Fair 14.4% |
| French | 23.7 /100 | #204 | Fair 14.4% |
| Trinidadians and Tobagonians | 23.5 /100 | #205 | Fair 14.4% |
| Scandinavians | 23.3 /100 | #206 | Fair 14.4% |